![Mastering Syslog Levels and Configuration in Cisco Networks [CCNP ENTERPRISE]](https://networkjourney.com/wp-content/uploads/2025/06/Mastering-Syslog-Levels-and-Configuration-in-Cisco-Networks_networkjourney.png)
Trainer Sagar Dhawan
- Posted on
Mastering Syslog Levels and Configuration in Cisco Networks [CCNP ENTERPRISE]
We’re diving into one of the most underutilized yet powerful tools in network troubleshooting—Syslog. Whether you’re a CCNA, CCNP aspirant, or a working professional in a NOC/SOC environment, having a deep understanding of Syslog Levels and Configuration will save you hours of guesswork and help you become a more efficient network engineer.
Syslog isn’t just a logging mechanism—it’s your network’s voice. From hardware failures to interface flaps and authentication logs, Syslog provides real-time insight into the health and security of your infrastructure. So let’s break it down step-by-step and configure it just like we do in live Cisco deployments.
Table of Contents
Theory in Brief: What is Syslog?
Syslog (System Logging Protocol) is a standard for message logging that allows network devices (like routers, switches, firewalls, etc.) to send event notification messages to a central server or terminal. These messages can include everything from routine operations to critical system failures.
Cisco IOS devices generate Syslog messages and send them to:
- The local console
- Logging buffer
- Remote Syslog server
- Terminal lines (vty, aux)
Why Syslog is Critical?
Syslog gives you visibility into:
- Interface status changes (up/down)
- Configuration changes
- Routing updates
- Security alerts
- System-level errors
It’s like a black box for your network—vital for real-time monitoring, auditing, and forensic investigations.
Understanding Syslog Severity Levels
Syslog messages are categorized by severity—levels 0 to 7, with 0 being the most critical.
| Level | Name | Description | Example |
|---|---|---|---|
| 0 | Emergency | System is unusable | Kernel panic, catastrophic failure |
| 1 | Alert | Immediate action needed | Loss of primary router |
| 2 | Critical | Critical conditions | Hardware errors |
| 3 | Error | Error conditions | Interface failure |
| 4 | Warning | Warning messages | High CPU usage |
| 5 | Notification | Normal but significant | Configuration saved |
| 6 | Informational | Informational messages | Link up/down |
| 7 | Debugging | Debug-level messages | ACL matches, debug outputs |
Summary – Benefits & Limitations
| Feature | Pros | Cons |
|---|---|---|
| Centralized Logging | Easier to correlate and audit events | Requires Syslog server |
| Severity Filtering | Customize log levels per destination | Misconfiguration can miss critical events |
| Real-time Visibility | Immediate fault notification | Flooding if debug (level 7) is overused |
| Persistent Storage | Useful for compliance and troubleshooting | Consumes disk space if not managed |
| Lightweight Protocol | Supported across almost all vendors | Uses UDP (no guarantee of delivery) |
Essential CLI Commands (Cisco IOS)
| Task | Command | Description |
|---|---|---|
| Set logging host | logging <IP> | Sends logs to external Syslog server |
| Enable console logging | logging console | Logs displayed on console |
| Set buffer logging | logging buffered <size> | Stores logs in router/switch memory |
| Set logging trap level | logging trap <level> | Controls which severity levels are sent |
| View log buffer | show logging | Displays local buffer logs |
| Disable logging | `no logging <console | monitor |
| Log config changes | archive log config | Monitors configuration events |
Real-World Use Case
| Scenario | Syslog Role | Outcome |
|---|---|---|
| ISP core router fails | Logs alert sent to NOC server | Engineers are immediately notified |
| Interface on switch flaps frequently | Level 3/4 logs indicate unstable port | Preventive replacement scheduled |
| Unauthorized login attempt detected | Level 5 logs show failed SSH access | Triggered automated lockdown script |
| Syslog integrated with SIEM (e.g., Splunk) | Security logs forwarded for analysis | Network anomalies correlated with events |
| Configuration changes in production | Notification level shows admin activity | Auditable change history |
EVE-NG LAB: Simulating Syslog Configuration
Lab Topology
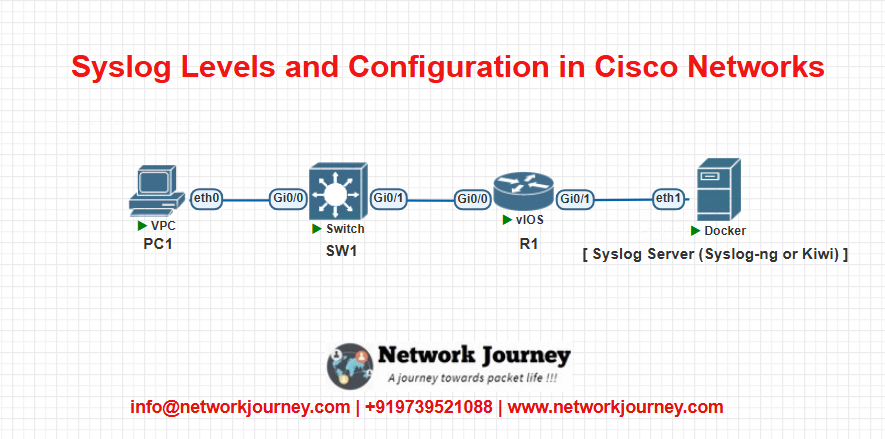
Goal: Configure R1 and SW1 to send Syslog messages to the Syslog server.
Lab Configurations
On Router R1:
conf t
hostname R1
logging 192.168.1.100      ! Syslog server IP
logging trap informational
logging buffered 10000
logging console
end
On Switch SW1:
conf t
hostname SW1
logging 192.168.1.100
logging trap warnings
logging monitor debugging
end
On Syslog Server:
Ensure syslog-ng, rsyslog, or Kiwi Syslog Server is installed and listening on UDP port 514.
Troubleshooting Tips
| Issue | Cause | Solution |
|---|---|---|
| Logs not received on Syslog server | Firewall blocking UDP 514 | Open port 514 UDP on server/router |
| Too many debug messages | Logging level set too low | Raise logging level to 4 or 5 |
| No logs on buffer | Buffer logging not enabled | Use logging buffered 8192 |
| Duplicate logs on console | Logging monitor and console both enabled | Use no logging console to reduce clutter |
| Logs lost on reboot | Not stored to external server | Use remote Syslog with persistent storage |
Frequently Asked Questions (FAQs)
1. What are Syslog severity levels and how are they structured?
Answer:
Syslog severity levels indicate the urgency or importance of a message, ranging from 0 (Emergency) to 7 (Debugging). Level 0 is the most critical, used for system-down events, while level 7 includes verbose debugging information. These levels help administrators filter and prioritize logs, ensuring critical issues are addressed immediately while routine logs are recorded for analysis.
2. What’s the difference between logging trap, logging buffered, and logging console?
Answer:
logging trap <level>: Sends logs of the defined severity (and higher) to remote Syslog servers.logging buffered <size>: Saves logs in the local buffer memory of the device.logging console: Displays logs in real time on the device’s console port.
Each serves a different destination and purpose, giving administrators flexibility based on the use case.
3. What severity level should I use in production environments?
Answer:
In production, a balanced level like 4 (Warnings) or 5 (Notifications) is recommended. This allows the capture of significant issues and important updates without overwhelming the logging server or system memory. Levels 6 (Informational) and 7 (Debug) can be used temporarily for troubleshooting, but are too verbose for ongoing operations.
4. How do I configure a Cisco router to send logs to a Syslog server?
Answer:
Here’s a basic configuration:
conf t
logging 192.168.1.100        ! IP of the Syslog server
logging trap informational   ! Set minimum severity level
logging on                   ! Enable logging
end
This setup ensures your router sends log messages of level 6 and above to the Syslog server.
5. Can I send logs to more than one Syslog server?
Answer:
Yes! Cisco IOS supports multiple Syslog destinations. Just use the logging <IP> command multiple times:
logging 192.168.1.100
logging 192.168.1.101
Each configured server will receive a duplicate copy of every log message that meets the severity filter.
6. What happens if I set the logging trap level to “debug”?
Answer:
Setting logging trap debugging (level 7) means all logs, including the most verbose debug messages, will be sent to the remote Syslog server. This can be useful for detailed troubleshooting, but be cautious—debug-level logs can consume bandwidth and storage rapidly and should not be left running in production.
7. Why are some Syslog messages not showing up on my server?
Answer:
Common causes include:
- Firewall blocking UDP port 514
- Incorrect trap severity level
- Logging not enabled (
logging on) - Syslog server misconfiguration
Ensure all necessary configurations are correct and that Syslog traffic is not being dropped or filtered in the network.
8. What port does Syslog use, and is it secure?
Answer:
Syslog uses UDP port 514 by default, which is not encrypted or reliable (no delivery guarantee). For enhanced security, use Syslog over TCP/TLS (port 6514) if supported by your network devices and server. You can also segment Syslog traffic using a management VLAN or IPsec tunnel for better control.
9. Can I log only specific events like configuration changes?
Answer:
Yes. Use Cisco’s configuration change logging feature:
archive
 log config
  logging enable
This will capture and log all configuration changes made via CLI, which is essential for auditing and compliance.
10. How can I view and export logs stored in the buffer?
Answer:
To view logs in the device’s memory buffer, use:
show logging
To export logs, you can copy them manually from the terminal output or use TFTP/FTP to export configurations and logs. However, for long-term storage and searching, it’s always best to forward logs to a remote Syslog server.
YouTube Link
Watch the Complete CCNP Enterprise: Mastering Syslog Levels and Configuration in Cisco Networks Lab Demo & Explanation on our channel:
Final Note
Understanding how to differentiate and implement Mastering Syslog Levels and Configuration in Cisco Networks is critical for anyone pursuing CCNP Enterprise (ENCOR) certification or working in enterprise network roles. Use this guide in your practice labs, real-world projects, and interviews to show a solid grasp of architectural planning and CLI-level configuration skills.
If you found this article helpful and want to take your skills to the next level, I invite you to join my Instructor-Led Weekend Batch for:
CCNP Enterprise to CCIE Enterprise – Covering ENCOR, ENARSI, SD-WAN, and more!
Get hands-on labs, real-world projects, and industry-grade training that strengthens your Routing & Switching foundations while preparing you for advanced certifications and job roles.
Email: info@networkjourney.com
WhatsApp / Call: +91 97395 21088
Upskill now and future-proof your networking career!
![DSCP vs CoS & Trust Boundary: Network Marking Demystified for Engineers[CCNP Enterprise]](https://networkjourney.com/wp-content/uploads/2025/07/DSCP-vs-CoS-Trust-BoundaryNetwork-Marking-Demystified-for-Engineers_networkjourney.png)
![Ticket#6 - DHCP Not Working on Access Layer – Troubleshoot Snooping and Relay [CCNP ENTERPRISE]](https://networkjourney.com/wp-content/uploads/2025/07/nj-blog-post-Ticket-6.jpg)