![Mastering IP SLA in Cisco Networks: Setup, Configuration & Real-World Use Case [CCNP Enterprise]](https://networkjourney.com/wp-content/uploads/2025/07/Mastering-IP-SLA-in-Cisco-Networks-Setup-Configuration-Real-World-Use-Case_networkjourney.png)
Trainer Sagar Dhawan
- Posted on
Mastering IP SLA in Cisco Networks: Setup, Configuration & Real-World Use Case [CCNP Enterprise]
As someone who’s been deep into routers and switches for over a decade, I’ve seen how critical IP SLA becomes when ensuring uptime and performance in real-world networks. Whether you’re working in enterprise, ISP, or data center environments—knowing how to configure, monitor, and troubleshoot IP SLA can make you the go-to guy (or gal!) in your team. In this guide, I’ll simplify the concepts, walk you through commands, and even show you a working EVE-NG lab. Let’s break it down together!
Table of Contents
Theory in Brief
What is IP SLA?
IP SLA (Internet Protocol Service Level Agreement) is a feature in Cisco IOS that allows you to measure network performance. With IP SLA, you can generate traffic (like ping, HTTP requests, UDP streams, etc.) to test network paths and track metrics such as latency, jitter, packet loss, and response time.
Why is IP SLA important?
In large-scale and business-critical networks, just having connectivity isn’t enough—you need to know if that connectivity is performing well. IP SLA helps network administrators make decisions about routing, failover, and performance tuning based on actual data rather than guesswork.
How does it work?
IP SLA works by configuring a source Cisco device to send probes to a destination. These probes mimic real traffic and help measure how the path performs. Based on thresholds, you can set alerts or even trigger dynamic routing decisions with features like object tracking.
Common IP SLA Operations:
- ICMP Echo (ping)
- HTTP GET
- UDP Jitter
- TCP Connect
- DNS Lookup
- VoIP-specific metrics (MOS, ICPIF)
Where is it used?
You’ll find IP SLA used in VoIP deployments, ISP edge networks, MPLS backups, cloud-based routing, and SD-WAN performance monitoring.
Summary / Comparison / Pros and Cons
| Feature | Description |
|---|---|
| Operation Types | ICMP Echo, UDP Jitter, HTTP, FTP, DNS, TCP Connect |
| Supported Devices | Cisco IOS-based routers and switches |
| Layer | Operates at Layer 3 (some probes simulate Layer 7 traffic) |
| Configuration Method | CLI or SNMP |
| Integration | Works with Object Tracking, EEM, and HSRP for dynamic failover |
Pros and Cons
| Pros | Cons |
|---|---|
| Accurate, real-time performance metrics | Only supported on Cisco devices |
| Triggers routing failover via Object Tracking | Complex configuration for advanced operations |
| Supports multiple protocols for simulation | Consumes CPU if too many operations are scheduled |
| Helps with VoIP and app performance diagnostics | Licensing may be needed for advanced features |
Essential CLI Commands (with Verify & Debug)
| Purpose | Command Example | Description |
|---|---|---|
| Configure ICMP Echo | ip sla 1icmp-echo 192.168.1.1frequency 10 | Sets up a ping operation |
| Schedule IP SLA | ip sla schedule 1 life forever start-time now | Starts the SLA operation |
| Verify SLA Status | show ip sla statistics | Shows current SLA metrics |
| Configure Object Tracking | track 1 ip sla 1 reachability | Tracks SLA success for failover use |
| Debug SLA | debug ip sla trace | Shows real-time probe activity |
| View Tracking Status | show track | Checks object tracking status |
Real-World Use Case
| Use Case | Description |
|---|---|
| MPLS Backup via IP SLA | IP SLA tracks internet reachability. If MPLS fails, traffic switches to DIA via tracking. |
| VoIP Quality Monitoring | UDP jitter and MOS scores tracked for ensuring voice quality across WAN links. |
| Cloud Service Monitoring | SLA configured to HTTP GET to cloud DNS or app servers for SLA compliance |
| DNS Server Health Check | SLA probes DNS resolution response time; failover to secondary server if response degrades |
| HSRP Failover Enhancement | HSRP tied with SLA + Object Tracking to switch to secondary gateway if primary path fails |
EVE-NG Lab – Small Demo with Diagram and Configs
Lab Topology
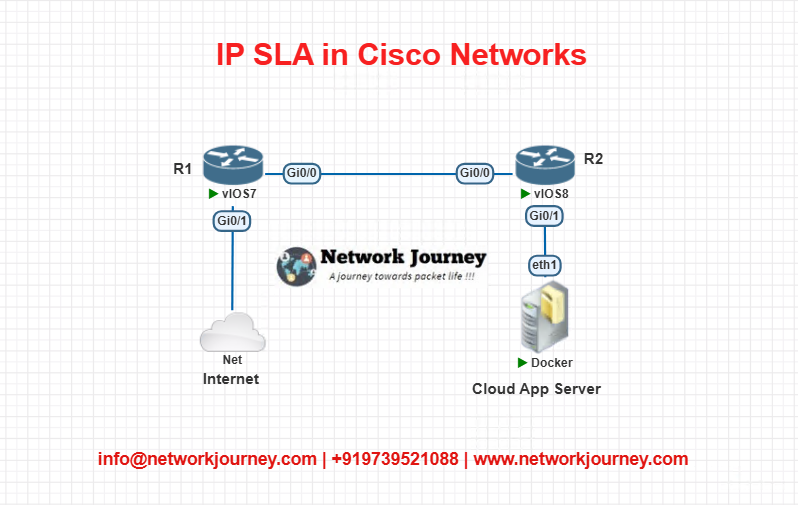
Objective:
- R1 sends IP SLA probes to a simulated cloud server.
- If the cloud is unreachable, R1 triggers a tracked route change.
R1 Configuration:
! Configure IP SLA
ip sla 1
 icmp-echo 10.10.10.2
 frequency 5
ip sla schedule 1 life forever start-time now

! Object Tracking
track 1 ip sla 1 reachability

! Static Routes with Tracking
ip route 0.0.0.0 0.0.0.0 192.168.1.2 track 1
ip route 0.0.0.0 0.0.0.0 192.168.2.2 200
R2 Configuration (Cloud End):
interface Loopback0
 ip address 10.10.10.2 255.255.255.255
Lab Verification:
show ip sla statistics
show track
debug ip sla trace
Troubleshooting Tips
| Symptom | Possible Cause | Troubleshooting Step |
|---|---|---|
| IP SLA stats not updating | SLA not scheduled | Check show ip sla configuration |
| Object tracking always down | Destination unreachable or ACL blocking | Use ping and debug ip sla trace |
| Route not changing on failure | Wrong track ID or metric issue | Confirm config with show track and show ip route |
| High CPU usage | Too many SLA operations at low interval | Increase frequency or reduce operations |
| Debug shows timeouts | ICMP blocked or destination not responding | Confirm IP reachability and ACL/NAT settings |
Frequently Asked Questions (FAQs)
1. What is IP SLA and how does it work in Cisco networks?
Answer:
IP SLA (Internet Protocol Service Level Agreement) is a Cisco IOS feature that enables real-time measurement of network performance by generating synthetic traffic. It works by configuring a Cisco device (typically a router or Layer 3 switch) to send probes to a target destination—such as another router, a server, or a public IP address. These probes simulate real application traffic (like ping, HTTP, or VoIP), and the device measures metrics like round-trip time, jitter, packet loss, and response time. This data helps network engineers evaluate service levels and take proactive action when issues arise.
2. Which types of operations can IP SLA perform?
Answer:
IP SLA supports a variety of operations to test different types of traffic:
- ICMP Echo – Measures latency using ping.
- UDP Jitter – For VoIP performance and delay variation.
- TCP Connect – Tests TCP handshake to a port (e.g., web server).
- HTTP GET – Measures response time of web applications.
- DNS Lookup – Measures domain resolution time.
- FTP/VoIP/MOS/ICPIF – Advanced tests for application-specific performance.
Each operation is chosen based on what type of network performance you’re trying to validate.
3. What is the difference between IP SLA and SNMP monitoring?
Answer:
The key difference lies in active vs passive monitoring:
- SNMP (Simple Network Management Protocol) is passive—it collects data from network devices based on polling intervals. It reports CPU usage, interface counters, and other statistics but doesn’t test traffic flows.
- IP SLA is active—it actually generates and sends traffic to test specific network paths and measure their performance. This gives you deeper insights into how applications behave over the network in real time.
For example, SNMP might show an interface is “up,” but IP SLA can reveal that HTTP response time is too high on that path.
4. Can IP SLA be used for automatic failover?
Answer:
Yes, absolutely. IP SLA is often used with Object Tracking and static routes or HSRP for automatic failover. When IP SLA detects a failure—such as the loss of a ping response or HTTP timeout—it updates the tracked object status to “down.” This can trigger the router to:
- Switch to a backup static route.
- Change the HSRP active router.
- Notify network admins using SNMP traps or EEM scripts.
This makes your routing behavior dynamic and responsive to real network conditions.
5. How is Object Tracking used with IP SLA?
Answer:
Object Tracking allows Cisco devices to monitor the result of IP SLA operations and make routing or redundancy decisions based on the results. For example:
track 1 ip sla 1 reachability
ip route 0.0.0.0 0.0.0.0 192.168.1.1 track 1
Here, the default route is only valid as long as the IP SLA probe (ID 1) is successful. If the tracked object goes down, the device removes the route from the routing table, allowing a secondary route or HSRP router to take over.
6. What are some common use cases for IP SLA in enterprise networks?
Answer:
Some real-world use cases include:
- WAN link monitoring: Ensure MPLS or DIA circuits are performing properly.
- Cloud app availability: Measure latency or HTTP responsiveness of cloud services.
- VoIP quality measurement: Use UDP jitter and MOS for monitoring voice quality.
- Failover detection: Trigger backup route or tunnel if primary path degrades.
- DNS failover: Switch to alternate DNS server if primary response time is too high.
These use cases are critical in hybrid cloud, branch connectivity, and multi-WAN designs.
7. Does IP SLA require a license or special hardware?
Answer:
Basic IP SLA operations like ICMP Echo, TCP Connect, and DNS Lookup are available on most Cisco IOS platforms without additional licenses. However:
- Advanced operations like VoIP MOS, UDP Jitter, or video monitoring may require IP SLA Responder support on the target device or a higher IOS feature set (like IP Base or IP Services).
- Older devices or ISR routers may need memory upgrades or specific IOS versions to support multiple concurrent operations.
Always check the Cisco Feature Navigator for compatibility and licensing.
8. How do I verify if IP SLA is working correctly?
Answer:
You can use several CLI commands to verify SLA status:
show ip sla statistics– Displays probe response times and success/failures.show track– Shows the current state of the tracked object.debug ip sla trace– Provides real-time probe info, useful for troubleshooting.show ip sla configuration– Verifies what operations are scheduled and their parameters.
A properly configured IP SLA operation will show successful round-trip times and status codes like “OK”.
9. Can I schedule multiple IP SLA operations at the same time?
Answer:
Yes. Cisco allows you to run multiple IP SLA operations simultaneously, which can monitor different destinations or use different protocols. For example:
ip sla 1
 icmp-echo 8.8.8.8
ip sla 2
 tcp-connect 192.0.2.1 443
ip sla schedule 1 life forever start-time now
ip sla schedule 2 life forever start-time now
However, running too many probes at a low interval (e.g., every second) can impact CPU performance. Monitor device utilization and adjust intervals accordingly.
10. What tools can be used to visualize IP SLA data?
Answer:
IP SLA metrics can be integrated into graphical network monitoring systems using SNMP or NetFlow. Some popular tools include:
- Cisco Prime Infrastructure
- SolarWinds Network Performance Monitor
- PRTG Network Monitor
- Zabbix and Nagios (with plugins)
- Grafana + Telegraf for SNMP polling
These tools allow you to visualize latency, jitter, and availability metrics in real-time dashboards and historical trend graphs—essential for SLAs and capacity planning.
YouTube Link
Watch the Complete CCNP Enterprise: Mastering IP SLA in Cisco Networks: Setup, Configuration & Real-World Use Case Lab Demo & Explanation on our channel:
Final Note
Understanding how to differentiate and implement Mastering IP SLA in Cisco Networks: Setup, Configuration & Real-World Use Case is critical for anyone pursuing CCNP Enterprise (ENCOR) certification or working in enterprise network roles. Use this guide in your practice labs, real-world projects, and interviews to show a solid grasp of architectural planning and CLI-level configuration skills.
If you found this article helpful and want to take your skills to the next level, I invite you to join my Instructor-Led Weekend Batch for:
CCNP Enterprise to CCIE Enterprise – Covering ENCOR, ENARSI, SD-WAN, and more!
Get hands-on labs, real-world projects, and industry-grade training that strengthens your Routing & Switching foundations while preparing you for advanced certifications and job roles.
Email: info@networkjourney.com
WhatsApp / Call: +91 97395 21088
Upskill now and future-proof your networking career!
![Redundancy Unleashed: Keeping Enterprise Networks Always-On [CCNP Enterprise]](https://networkjourney.com/wp-content/uploads/2025/06/Redundancy-Unleashed_-Keeping-Enterprise-Networks-Always-On_networkjourney.png)
![Can ARP ACLs Replace DHCP Snooping for ARP Security? Let’s Find Out! [CCNP ENTERPRISE]](https://networkjourney.com/wp-content/uploads/2025/07/nj-blog-post-ARP-ACLs.jpg)
![Troubleshooting HSRP – How to Detect and Fix Gateway Redundancy Issues [CCNP Enterprise]](https://networkjourney.com/wp-content/uploads/2025/07/Troubleshooting-HSRP-–-How-to-Detect-and-Fix-Gateway-Redundancy-Issues_networkjourney.png)