![Wireshark Filter Mastery: Pro-Level Tips for Layer 2 & Layer 3 Packet Analysis [CCNP Enterprise]](https://networkjourney.com/wp-content/uploads/2025/07/Wireshark-Filter-Mastery_Pro-Level-Tips-for-Layer-2_Layer-3-Packet-Analysis_networkjourney.png)
Trainer Sagar Dhawan
- Posted on
Wireshark Filter Mastery: Pro-Level Tips for Layer 2 & Layer 3 Packet Analysis [CCNP Enterprise]
As a network trainer and hands-on engineer, I’ve seen engineers struggle not with capturing packets—but with filtering them effectively in Wireshark. Trust me, if you don’t filter the noise, your packet captures become digital haystacks. That’s why in this post, I’m sharing battle-tested Wireshark filter tips, specifically tailored for Layer 2 and Layer 3 scenarios. Whether you’re troubleshooting a VLAN issue or tracking an IP conflict, these filter hacks will save you hours of head-scratching. Let’s dive in and make Wireshark your best friend!
Table of Contents
Theory in Brief
What is Wireshark?
Wireshark is the world’s most popular network protocol analyzer. It captures packets in real time and lets you inspect every field—down to the bit level. It supports hundreds of protocols and is used by network engineers, cybersecurity experts, and developers.
Why do filters matter?
In modern networks, you’re not just capturing a few packets—you’re pulling thousands every second. Without proper filters, meaningful analysis becomes impossible. Filters help narrow down the noise, highlight anomalies, and zoom in on issues like broadcast storms, spanning tree loops, ARP conflicts, DNS delays, and TCP retransmissions.
Layer 2 vs Layer 3 filtering:
At Layer 2, you deal with MAC addresses, VLAN tags, and Ethernet types. At Layer 3, the focus shifts to IP addressing, routing protocols, and ICMP/TCP/UDP headers. Knowing what and where to filter is crucial—Wireshark gives you surgical precision for both.
Capture vs Display Filters:
- Capture Filters are set before the capture starts (like
host 192.168.1.1) - Display Filters are applied after capture to dissect traffic (like
ip.src == 192.168.1.1)
Summary / Comparison / Pros and Cons
Key Comparison of Layer 2 vs Layer 3 Filtering
| Filter Level | Focus Areas | Example Filter | Use Case |
|---|---|---|---|
| Layer 2 | MAC address, VLAN, EtherType | eth.src == 00:11:22:33:44:55 | Track specific host’s Ethernet traffic |
| Layer 3 | IP address, ICMP, Routing protocols | ip.dst == 192.168.1.1 | Trace packets to a destination device |
Pros and Cons of Using Wireshark Filters
| Pros | Cons |
|---|---|
| Pinpoint accuracy in traffic analysis | Complex syntax can confuse new users |
| Great for both real-time and offline analysis | Display filters don’t reduce capture file size |
| Vast protocol support | Too many filters can slow down analysis |
| Open source and widely supported | Requires admin rights for some capture interfaces |
Essential CLI Commands for Filter-Based Troubleshooting
Here are some essential Wireshark-related CLI commands and TCP/IP stack helpers you’ll often use:
| Task | Command | Description |
|---|---|---|
| Start Wireshark with capture filter | wireshark -f "host 10.10.10.1" | Captures only traffic to/from specific IP |
| Display MAC address filter | eth.addr == aa:bb:cc:dd:ee:ff | Shows Layer 2 traffic from a specific device |
| Display IP filter | ip.addr == 192.168.0.10 | Filters packets with specific IP |
| Show ARP traffic | arp | Useful for detecting ARP storms |
| View DNS queries | dns && ip.addr == 8.8.8.8 | DNS to/from Google’s public DNS |
| TCP retransmissions | tcp.analysis.retransmission | Detects performance issues in TCP |
| ICMP troubleshooting | icmp | For ping and network unreachable analysis |
Real-World Use Case
| Scenario | Filter Used | Purpose/Benefit |
|---|---|---|
| Troubleshoot ARP issues | arp | Detect IP conflicts or excessive broadcasts |
| Analyze VLAN tagging problems | vlan.id == 100 | Isolate traffic on VLAN 100 |
| Identify rogue DHCP server | bootp.option.dhcp == 1 | Detect unauthorized DHCP offers |
| Diagnose slow HTTP application | http.request + tcp.analysis.flags | Find delays or TCP retransmissions |
| Monitor specific user IP | ip.addr == 192.168.1.100 | Trace user-specific problems |
| Find spanning tree loops | stp or llc.dsap == 0x42 | Detect excessive STP BPDUs |
EVE-NG Lab – Basic Layer 2 & 3 Capture
Lab Topology
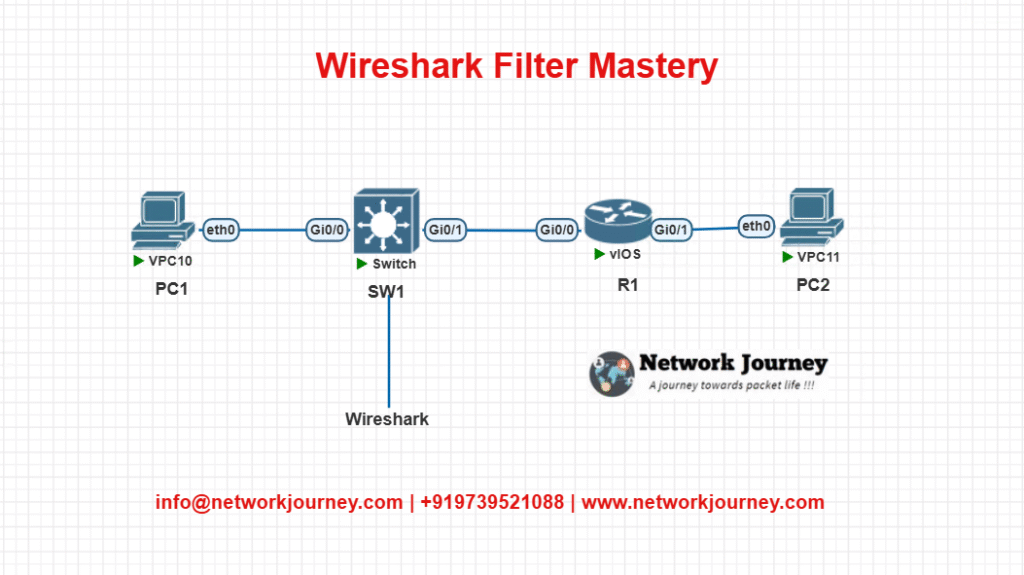
Goal:
- Capture packets between PC1 and PC2 using Wireshark.
- Filter based on VLAN, IP, and ICMP.
Configuration Summary
R1:
interface Gig0/0
 ip address 192.168.1.1 255.255.255.0
 no shut
PC1:
ip address 192.168.1.10 255.255.255.0
PC2:
ip address 192.168.1.20 255.255.255.0
SW1 (optional VLAN config):
vlan 10
interface fa0/1
 switchport mode access
 switchport access vlan 10
Wireshark Interface:
Start capture on the interface connected to SW1, apply filters like:
ip.addr == 192.168.1.10icmpeth.src == 00:11:22:33:44:55
Troubleshooting Tips
| Symptom | Possible Cause | Filter or Command to Use |
|---|---|---|
| Too many packets | No filter applied | Use ip.addr == x.x.x.x |
| Cannot see VLAN traffic | Capture not done on trunk port | Use vlan.id == <VLAN> and capture on trunk |
| ARP flooding | IP conflict or rogue device | Use arp to identify high frequency requests |
| DNS timeout | Resolver unreachable | Use dns + ip.addr == 8.8.8.8 |
| Missing ICMP replies | ACL or firewall dropping echo reply | Use icmp to isolate dropped packets |
Frequently Asked Questions (FAQs)
1. What’s the difference between Capture Filters and Display Filters in Wireshark?
Answer:
Capture Filters are applied before packet collection begins. They determine what traffic gets captured by Wireshark. For example, if you set a capture filter like host 192.168.1.1, only traffic to or from that host will be captured.
Display Filters, on the other hand, are applied after the capture. They help you drill down into specific packets from a larger capture set. For example, ip.addr == 192.168.1.1 shows all packets involving that IP within the existing capture file.
2. How can I filter traffic from a specific MAC address?
Answer:
Use Wireshark’s display filter:eth.addr == 00:11:22:33:44:55
This will show all packets with the specified MAC address as either the source or destination. If you want to filter by direction, use:
eth.src == 00:11:22:33:44:55for sourceeth.dst == 00:11:22:33:44:55for destination
This is useful for identifying Layer 2 issues or tracking rogue devices.
3. Can I use Wireshark to detect VLAN tagging problems?
Answer:
Yes. You can apply the filter:vlan
to show all VLAN-tagged traffic. To filter by VLAN ID specifically, use:vlan.id == 100
If VLANs are misconfigured or missing tags, these filters will help you confirm if tags are present or if traffic is being sent untagged over trunk ports.
4. How do I detect ARP spoofing or duplicate IP addresses with Wireshark?
Answer:
Use the filter:arp
Look for multiple ARP replies mapping the same IP address to different MAC addresses. That’s a clear sign of ARP spoofing or IP conflict. Also, excessive ARP requests from one host may indicate a misconfigured or rogue device.
5. Is it possible to monitor ping (ICMP Echo) traffic using Wireshark?
Answer:
Absolutely. Use the filter:icmp
to capture both Echo Requests and Echo Replies.
For direction-specific filters:
icmp.type == 8for Echo Request (ping)icmp.type == 0for Echo Reply
This is helpful when troubleshooting network reachability and packet loss.
6. How can I analyze slow HTTP or web application performance?
Answer:
Use these filters:
http.request– to see all client HTTP requestshttp.response– to analyze server repliestcp.analysis.retransmission– to identify packet retransmissions
You can also right-click on a TCP stream and use “Follow → TCP Stream” to view the entire conversation between the client and server.
7. What’s the best way to filter DNS queries and responses?
Answer:
Use the filter:dns
To monitor DNS traffic involving a specific IP (like Google DNS), use:dns && ip.addr == 8.8.8.8
This helps when diagnosing resolution delays, misconfigured DNS servers, or DNS-related connectivity issues.
8. How do I troubleshoot TCP connection issues with Wireshark?
Answer:
Use filters like:
tcp.flags.syn == 1to see TCP connection attemptstcp.analysis.retransmissionto catch retransmitted packetstcp.analysis.flagsto view handshake, resets, or zero-window conditions
These help identify issues like slow handshakes, packet loss, or congestion.
9. Can I use Wireshark to detect a STP (Spanning Tree Protocol) loop?
Answer:
Yes. Use the filter:stp
orllc.dsap == 0x42
If you see excessive BPDUs from multiple sources or repeated TCNs (Topology Change Notifications), it may indicate a spanning-tree issue or loop forming in the Layer 2 network.
10. Can I apply filters in EVE-NG or GNS3 when running Wireshark captures?
Answer:
Yes. In both EVE-NG and GNS3, when you launch Wireshark to capture packets on virtual links, you can apply display filters just like on physical networks.
Examples:
ip.addr == 192.168.1.10to focus on a single hosticmpto observe pingseth.src == <MAC>for Layer 2 filtering
This helps in lab simulations when debugging L2-L3 behavior without real devices.
YouTube Link
Watch the Complete CCNP Enterprise: Wireshark Filter Mastery: Pro-Level Tips for Layer 2 & Layer 3 Packet Analysis Lab Demo & Explanation on our channel:
Final Note
Understanding how to differentiate and implement Wireshark Filter Mastery: Pro-Level Tips for Layer 2 & Layer 3 Packet Analysis is critical for anyone pursuing CCNP Enterprise (ENCOR) certification or working in enterprise network roles. Use this guide in your practice labs, real-world projects, and interviews to show a solid grasp of architectural planning and CLI-level configuration skills.
If you found this article helpful and want to take your skills to the next level, I invite you to join my Instructor-Led Weekend Batch for:
CCNP Enterprise to CCIE Enterprise – Covering ENCOR, ENARSI, SD-WAN, and more!
Get hands-on labs, real-world projects, and industry-grade training that strengthens your Routing & Switching foundations while preparing you for advanced certifications and job roles.
Email: info@networkjourney.com
WhatsApp / Call: +91 97395 21088
Upskill now and future-proof your networking career!
![Virtual Network Functions (VNFs) – The Future of Flexible Networking [CCNP Enterprise]](https://networkjourney.com/wp-content/uploads/2025/06/Virtual-Network-Functions-_VNFs-–-The-Future-of-Flexible-Networking-_networkjourney.png)
![OSPF Area Types Explained: Stub, Totally Stubby & NSSA with CLI, Lab & Real-World Use Cases. [CCNP ENTERPRISE]](https://networkjourney.com/wp-content/uploads/2025/06/OSPF-Area-Types-Explained_Stub_Totally-Stubby_NSSA_networkjourney.png)
![LACP vs PAgP: Cisco EtherChannel Types Explained with CLI & EVE-NG Lab [2025]. [CCNP ENTERPRISE]](https://networkjourney.com/wp-content/uploads/2025/06/LACP-vs-PAgP_-Cisco-EtherChannel-Types-Explained-with-CLI_networkjourney.png)