Trainer Sagar Dhawan
- Posted on
[Day 116] Cisco ISE Mastery Training: SIEM Integration (Splunk, QRadar, ArcSight)
Table of Contents
Introduction
Security telemetry is only useful if it’s collected, parsed, enriched, and acted upon. Cisco ISE holds critical identity, posture, and access events (802.1X, MAB, RADIUS Access-Accept/Reject, posture results, CoA actions, ANC), but those events must be consumed by your SOC fabric so correlation, detection rules, dashboards and playbooks can use identity context.
Integrating ISE with your SIEM achieves two powerful changes:
- Identity enrichment of every network event: SOC analysts can see “who” and “what device” was involved in an alert, not just IPs.
- Actionable detections: SIEM correlation rules can automatically raise high-confidence incidents that—when combined with ISE—enable automatic containment (via ERS/pxGrid/CoA) or targeted investigations.
This Article will make SIEM integration a reproducible, validated process: Syslog/TLS pipelines, event field extraction, pxGrid/contextual enrichment, API pulls (ERS), and verification steps for Splunk, QRadar and ArcSight. We focus on exact clicks, commands, test events, parsing examples and acceptance criteria so you can implement this in production with confidence.
Problem Statement
Enterprises often face these gaps:
- SIEMs ingest network logs but lack identity (user/device) context making triage slow.
- ISE logs sit in ISE MnT and are not forwarded reliably to SIEM, or are forwarded but not parsed into meaningful fields.
- SOC hunts and automated playbooks need real-time session details (username, MAC, switch port, authorization profile) — not just text blobs.
- Auditors require reproducible evidence: time-stamped trace from authentication → decision → enforcement.
Goal: build reliable, secure pipelines that deliver ISE events to SIEMs (Splunk/QRadar/ArcSight) with consistent field extraction, optional pxGrid session enrichment, and documented validation so SOC can detect and respond faster.
Solution Overview
We implement a multi-layer integration pattern:
- Syslog Export from ISE → SIEM (primary channel): ISE sends syslog (UDP/TCP/TLS) for RADIUS events, ACLs, system, posture, and authorization events. SIEM collects and parses into structured fields.
- pxGrid (optional/advanced) → SIEM or CTI platform: For real-time session directory and identity context, SIEM can subscribe to pxGrid (either directly or via a pxGrid→SIEM connector) to enrich events with active session attributes: username, MAC, switch port, VLAN, SGT, posture state.
- ERS / API pulls (on demand): SIEM playbooks can call ISE ERS APIs to fetch session details, or to request actions (CoA/erase/clear ANC).
- Validation & parsing: create SIEM parsing rules (SPL regex / DSM / connector mapping) to extract the canonical fields SOC needs: timestamp, username, src_ip, mac, NAS ip, request type, result, authorization profile, posture result, session id.
The workbook provides exact GUI steps and CLI checks for ISE + Splunk (syslog & HEC), QRadar (syslog + Log Source), and ArcSight (SmartConnector syslog/TCP/TLS) plus pxGrid and ERS usage.
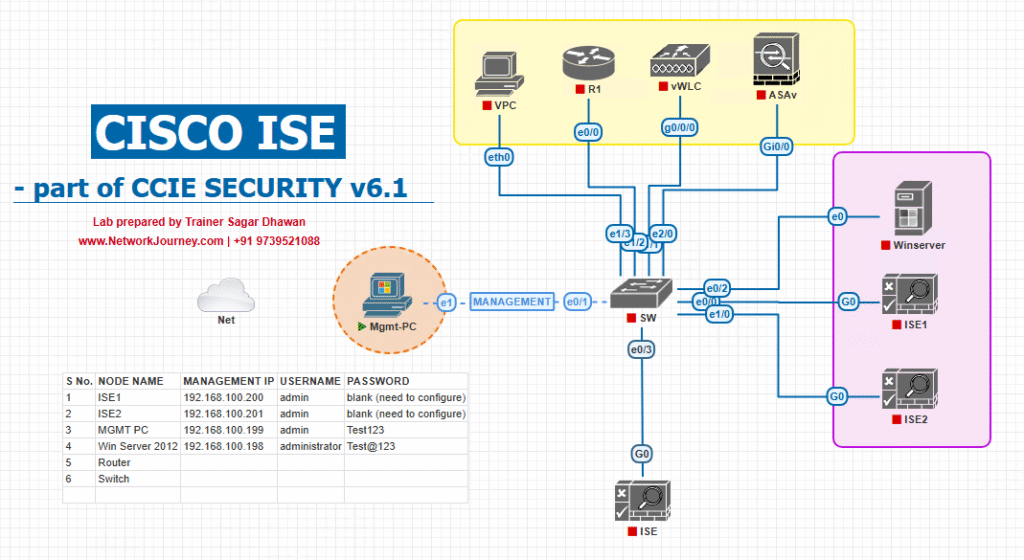
Sample Lab Topology
Minimum lab appliances (VMware or EVE-NG friendly):
- Cisco ISE (PAN / MnT + PSN) — VMware VMs (ISE 2.x/3.x).
- SIEM VMs: Splunk Enterprise (or Splunk Cloud dev instance), IBM QRadar CE or QRadar VM, ArcSight ESM (or ArcSight dev VM) with SmartConnectors.
- Access switch: Catalyst 9300 (or CSR1000v generating NetFlow / RADIUS events).
- WLC or VPN headend if testing wireless/VPN events.
- Endpoints: Windows 10/11 client(s) to generate 802.1X, posture, AnyConnect events.
- Jump host for running cURL / OpenSSL / netcat tests.
- (Optional) pxGrid client machine for Splunk pxGrid connector (e.g., Splunk HTTP Event Collector + pxGrid client script).
Topology :
Step-by-Step GUI Configuration Guide
PRECHECKS — Always run first
- NTP & DNS: ISE and SIEM servers must be time-synced (NTP) and resolve FQDNs.
- CLI jump host:
nslookup ise.pan.lab chronyc tracking # or ntpq -pn date -R - Expected: DNS resolves; clocks within ±2 seconds.
- CLI jump host:
- Certificates: If using TLS syslog or HEC over HTTPS, ensure certificates (public CA or corporate CA) are trusted by both ends.
- Network reachability: From ISE, test TCP/UDP ports to SIEM.
nc -vz splunk.lab 514 # UDP/TCP 514 check (nc -u for UDP) curl -k https://splunk.lab:8088/services/collector/ -I
STEP A — Configure ISE to send Syslog to SIEM (common to all SIEMs)
ISE GUI (Administration → System → Logging → Remote Logging Targets or Administration → System → Logging):
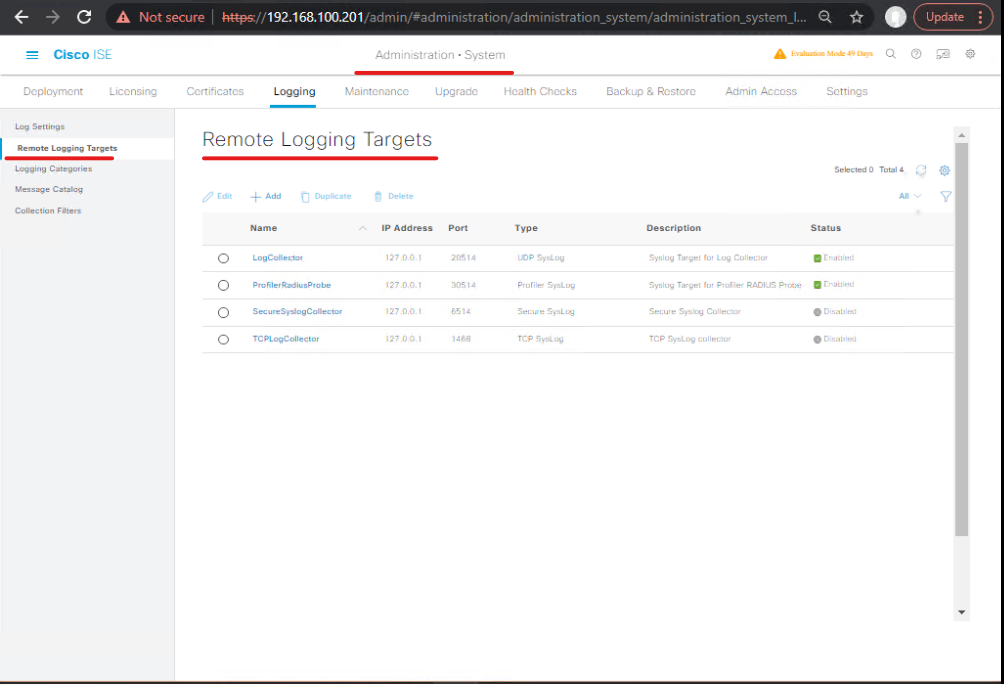
- Add Remote Syslog Target
- Click Add → enter:
- Name:
SIEM-Splunk(orSIEM-QRadar,SIEM-ArcSight) - IP / Hostname: SIEM collector IP
- Protocol: TCP 6514 (TLS recommended) or UDP 514 / TCP 514
- Port: 6514 for TLS, 514 for plain
- Use TLS: Yes (recommended).
- Certificate / Trust Settings: attach ISE node certificate or trust chain if TLS required.
- Name:
- Click Add → enter:
- Select Logging Categories & Levels
- Under the target config, choose categories to send (Authentication, Authorization, RADIUS, Posture, System, MnT, pxGrid events if available). Start broad (auth + radius + posture) then reduce verbosity in prod.
- Save and verify target appears in list.
Validation (ISE CLI & GUI)
- GUI:
Administration → System → Logging → Remote Logging Targetsshows the new entry. - CLI (ISE SSH):
show logging summary show logging application ise-psc.log tail 50 - Test: trigger an authentication event (connect client, produce Access-Request). Then check:
- On SIEM: logs arrive at listener (see SIEM section below).
- On ISE:
show logging application ise-psc.logshould show send attempts (or errors if TLS handshake fails).
STEP B — Splunk: set up listener & parsing
Two common ingestion patterns:
- Syslog ingestion: Splunk Universal Forwarder or syslog-ng → Splunk indexer listens on UDP/TCP 514 or TLS 6514.
- HTTP Event Collector (HEC): ISE cannot natively push HEC; but you can use an intermediate forwarder (script or nxlog) to convert syslog → HEC.
Syslog method (recommended)
- On Splunk indexer / heavy forwarder: set up a TCP/TLS syslog input.
- Splunk Web → Settings → Data inputs → TCP → port 6514 (enable TLS). Upload server cert/key for TLS.
- Set sourcetype:
cisco:iseorcisco:ise:syslog. Select index:iseormain.
- Install Splunk Add-on for Cisco ISE (if available) or create a custom sourcetype and field extractions.
- Add-on provides CIM mapping and dashboards.
- Configure props.conf/transforms.conf for field extraction (timestamp, username, src_ip, mac, NasIP, Result).
- Test: Generate a test authentication on a client:
- On Jump host:
# Example: simulate by creating a test log file and sending with logger logger -n splunk.lab -P 6514 -T "ISE_TEST: Access-Accept user=alice src=10.10.10.55 NAS=10.0.0.1" - Splunk search:
index=ise sourcetype="cisco:ise" "Access-Accept" | table _time host user src_ip nas_ip message
- On Jump host:
HEC method (optional) — use nxlog or script on a collector to forward structured JSON to Splunk HEC:
curl -k https://splunk.lab:8088/services/collector/event \
 -H "Authorization: Splunk <HEC_TOKEN>" \
 -d '{"event":"ISE Access-Accept user=alice src=10.10.10.55"}'
Validation
- Splunk shows events. Use sample SPL to verify important fields:
index=ise sourcetype="cisco:ise" user=* | stats count by user, src_ip
STEP C — IBM QRadar: configure Log Source & Validation
QRadar accepts syslog over UDP/TCP/TLS; use a Log Source with correct DSM.
- Create Log Source in QRadar
- Admin → Data Sources → Log Sources → Add.
- Log Source Type: Generic Syslog or Cisco ISE DSM (if available).
- Protocol Configuration: Syslog (TCP/TLS) port 6514 or UDP 514.
- Log Source Identifier: configure to match ISE host/hostname.
- Configure Endpoint on ISE: Add QRadar collector IP as Remote Syslog (as in STEP A) and send RADIUS/auth logs.
- Generate test event: Authenticate a client. Then in QRadar:
- Log Activity → search for log source name or content
Access-Acceptor username. - Use AQL or Log Activity filters:
select * from events where "username" = 'alice'(example) or filter by Log Source.
- Log Activity → search for log source name or content
- Tuning / Event parsing
- If QRadar categorizes as
Unknown, create a custom DSM or regex mapping to extract fields. - Map fields to Asset/IP/Username fields for correlation.
- If QRadar categorizes as
Validation
- QRadar Log Activity shows ISE events; building correlation rules: test rule triggers when
RADIUS Access-Rejectplus multiple failures. - Use
AQL:SELECT username, sourceip, qidName FROM events WHERE logSourceIdentifier='ISE' AND "Access-Accept" IS NOT NULL LAST 5 MINUTESAdjust to environment.
STEP D — ArcSight: SmartConnector (syslog) & parsing
- Install or configure an ArcSight SmartConnector to listen on syslog port (UDP 514 / TCP 6514 TLS).
- SmartConnector type: Universal/Generic Syslog or Cisco ISE connector if available.
- Configure Device Event Class ID mapping and field normalization.
- ISE Remote Logging target: add ArcSight collector IP and protocol (TLS preferred). See STEP A.
- Test: Trigger authentication. In ESM Console:
- Search Events:
deviceVendor = "Cisco" AND deviceProduct = "ISE" AND message CONTAINS "Access-Accept" - Build a view/dashboards to display
sourceAddress,userName,eventName.
- Search Events:
- Parsing & normalization: Use connector properties (regex) to extract
userName,srcIP,nasIP,macAddress,result.
Validation
- ESM shows normalized fields; create rule to alert on repeated Access-Reject for same user.
STEP E — pxGrid enrichment (advanced, optional but high value)
Purpose: augment SIEM events with real-time session context (ISE session directory) instead of only relying on syslog text.
- Enable pxGrid on ISE
- Administration → System → Settings → pxGrid Services → Enable.
- Register SIEM (or connector) as pxGrid client
- On SIEM connector host (e.g., Splunk pxGrid connector), generate client certificate or use the connector wizard (if available).
- In ISE → Work Centers → pxGrid Services → Approve the client.
- Subscribe to topics (Session, Identity, Posture). The pxGrid connector forwards events to SIEM (via HTTP/HEC or syslog) or SIEM queries pxGrid for active session attributes during incident enrichment.
- SIEM playbook usage
- On SIEM alert, call pxGrid (or connector) to fetch
username,mac,switch,port,authorizationProfilefor thesrc_ipin the alert, then add to alert context or run automatic ERS action.
- On SIEM alert, call pxGrid (or connector) to fetch
Validation
- From SIEM, call pxGrid query for active session: expect JSON with fields
username,endpointIP,macAddress,sessionID. - In Splunk, verify appended fields via pull or via connector logs.
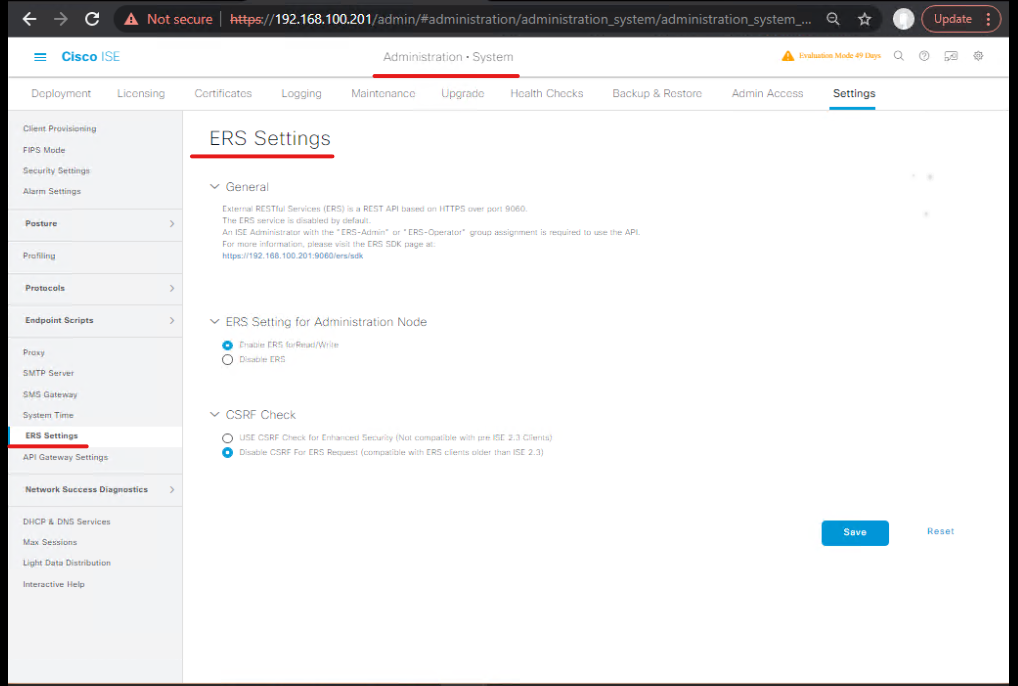
STEP F — ERS API (pulls & actions) for automation
Use cases: enrichment (pull session info) and action (CoA/ANC). Example ERS API call to fetch session details:
- Enable ERS
- ISE: Administration → System → Settings → ERS Settings → Enable. Create ERS user (ERS API admin).
- Sample GET session (curl)
curl -k -u ers_user:ers_pwd \ "https://ise.pan.lab:9060/ers/config/session?ipaddress=10.10.10.55"- Response includes session attributes (username, endpointName, protocol, NAD info).
- Sample Apply CoA / ANC via ERS (POST)
curl -k -u ers_user:ers_pwd -H "Content-Type: application/json" \ -X POST https://ise.pan.lab:9060/ers/config/ancendpoint/apply \ -d '{"OperationAdditionalData":{"additionalData":[{"name":"macAddress","value":"AA:BB:CC:DD:EE:FF"},{"name":"policyName","value":"QUARANTINE-DACL"}]}}'- Inspect response job id and later status.
Validation
- The API returns
202 Acceptedand job id. Check ISE logs for ERS requests and the switch for CoA events.
STEP G — Parsing examples & sample queries
Splunk SPL examples
- Find authentication accept:
index=ise sourcetype="cisco:ise" "Access-Accept" | rex "user=(?<user>\S+)" | stats count by user, src_ip - Session enrichment via pxGrid (pseudo):
index=network_events src_ip=10.10.10.55 | lookup ise_sessions src_ip OUTPUT username, mac, switch, port
QRadar AQL (sample)
- Recent Accepts:
SELECT username, sourceip, deviceEventCount FROM events WHERE logsourceid = 'ISE' AND qidname LIKE '%Access-Accept%' LAST 15 MINUTES
ArcSight ESM query (example)
- Filter:
deviceVendor = "Cisco" AND deviceProduct = "ISE" AND eventName = "RADIUS Access-Accept"
STEP H — Evidence pack & acceptance criteria (must collect)
For each integration test collect:
- ISE Remote Logging target list with SIEM entries.
- SIEM listener showing incoming ISE events (raw message).
- CLI:
show logging summary(ISE) saved to file. - SIEM parsed event (fields: timestamp, user, src_ip, NAS, outcome).
- pxGrid connector logs (if used).
- ERS API request/response JSON saved.
- Test matrix CSV:
TestCase,StartTS,EndTS,User,EndpointIP,ISE_Log_File,SIEM_EventID,Result,Notes.
Acceptance criteria
- Events generated by ISE (auth, posture, CoA) appear in SIEM within expected latency (<60s for syslog/TLS in lab).
- SIEM extracts
username,src_ip,mac(if present),nas_ip,resultinto fields. - pxGrid enrichment returns session attributes for SIEM lookup within seconds.
- ERS actions (if used) are executed and CoA applied (verify on switch).
Expert-Level Use Cases
- Real-time detection → auto-containment playbook: SIEM correlates IOCs + unusual RDP login → calls ISE ERS to apply quarantine DACL → SOC ticket auto-created.
- User-centric alerts: combine firewall IDS + ISE username via pxGrid lookup and display user name in SIEM alerts for fast SOC triage.
- Threat enrichment pipeline: SIEM appends ISE posture score + SGT to threat events — adjust incident priority.
- Forensic storyboarding: correlate Splunk logs (proxy), ISE auth logs, and NAC CoA events to build a timeline of compromise.
- Automated false-positive rollback: playbook applies containment, runs automated remediation tests, and if false positive, clears ANC via ERS and annotates SIEM.
- Compliance evidence bundles: scheduled exports in SIEM produce time-bounded proof of who accessed sensitive networks and any containment actions.
- Tenant / MSP multi-SIEM mapping: ISE sends tenant tags; SIEMs ingest grouped events per tenant with automated report generation.
- Adaptive detection tuning: SIEM aggregate stats (top auth fails, frequent CoA hits) feed ISE policy changes via automated PRs.
- Service desk automation: SIEM creates an incident with ISE session snapshot + prefilled remediation steps for helpdesk.
- Red-team pipelines: run containment drills via SIEM trigger → ERS → measure mean time to contain and build SLAs.
FAQs – Cisco ISE SIEM Integration (Splunk, QRadar, ArcSight)
Q1. What logs does Cisco ISE forward to SIEM platforms (Splunk, QRadar, ArcSight)?
Answer:
Cisco ISE forwards syslog events such as:
- Authentication logs (RADIUS, TACACS+).
- Authorization decisions (Permit/Deny with applied policy).
- Posture assessments (Compliant/Non-Compliant).
- Threat intelligence events (via pxGrid, AMP, Stealthwatch, Umbrella).
- System and administrative audit logs.
GUI Validation:
- Navigate to Administration → System → Logging → Remote Logging Targets → Verify configured SIEM targets.
- Under Operations → Reports, confirm events are generated.
CLI Validation:
ise/admin# show logging application
ise/admin# show logging status
Q2. How do I configure Cisco ISE to send logs to Splunk?
Answer:
- In ISE GUI → Administration → System → Logging → Remote Logging Targets → Add.
- Enter Splunk Syslog Receiver IP, port (default 514), protocol (UDP/TCP).
- Add this target to your Logging Categories (Authentication, Posture, etc.).
Splunk Validation:
- Run a search:
index=cisco_ise sourcetype=cisco:ise:syslog
- You should see live ISE logs populating.
Q3. What is the difference between pxGrid-based integration and Syslog-based SIEM integration?
Answer:
- Syslog-based: Push-only. ISE sends events in syslog format to SIEM. Limited to raw event logging.
- pxGrid-based: Bi-directional. SIEM (Splunk, QRadar) can query contextual session data from ISE (user, device, posture, SGT).
Use syslog for bulk log ingestion.
Use pxGrid for context-aware threat hunting and real-time correlation.
Q4. How do I validate that QRadar is parsing Cisco ISE logs correctly?
Answer:
- In QRadar → Log Activity → Run filter:
Device Type = Cisco ISE - Check fields like username, NAS-IP, Session-ID, Policy-Result.
- Ensure DSM (Device Support Module) for Cisco ISE is installed and parsing rules applied.
CLI on ISE to confirm logs leaving:
ise/admin# show logging info
Q5. What troubleshooting steps if logs are not arriving in SIEM?
Answer:
- Check firewall rules between ISE and SIEM (UDP/514, TCP/1468).
- Validate ISE Logging Target config.
- Ensure time sync (NTP) between ISE & SIEM to avoid log rejection.
- On ISE CLI:
ise/admin# test logging target <SIEM_IP>
- On Splunk CLI:
tcpdump -i eth0 port 514
Q6. How does Cisco ISE log forwarding help in threat response?
Answer:
- Enables centralized visibility of NAC events in SIEM.
- Correlation: Login failures in ISE + Firewall deny logs = Brute force attack.
- Automated response: Splunk/QRadar rule triggers ISE pxGrid quarantine API call.
- Forensics: Endpoint posture logs in SIEM for compliance auditing.
Q7. Can I send Cisco ISE logs to multiple SIEMs simultaneously (Splunk + ArcSight)?
Answer:
Yes. ISE supports multiple remote logging targets.
- Configure each SIEM IP separately.
- Assign them to required log categories.
Example: Authentication → Splunk, Threat → ArcSight.
Q8. How to integrate ISE with ArcSight for compliance reporting?
Answer:
- Configure ISE → Syslog Target → ArcSight Connector IP/Port.
- On ArcSight, deploy SmartConnector for Cisco ISE.
- Validate that fields like Session ID, User, Device MAC, SGT are normalized.
Compliance use case: PCI-DSS requires authentication & authorization logs, which ISE provides via SIEM.
Q9. What best practices should be followed for SIEM integration?
Answer:
- Always use TCP syslog (reliable delivery) for critical logs.
- Enable log filtering (don’t flood SIEM with debug events).
- Categorize logs by type (Auth, Posture, Threat).
- Ensure TLS syslog (RFC 5425) for secure delivery.
- Monitor ISE disk usage → avoid log buffer overflow.
Q10. How do I integrate Splunk with ISE using pxGrid for advanced analytics?
Answer:
- Enable pxGrid Services in ISE → Administration → pxGrid Services.
- Install Splunk Cisco ISE Add-on for pxGrid.
- Configure pxGrid node certificate trust between ISE & Splunk.
- Use Splunk queries:
sourcetype=cisco:ise:pxgrid session.user="*" | stats count by device_ip, username, sgt - Automate ISE Adaptive Network Control (ANC) actions (e.g., quarantine endpoint).
YouTube Link
For more in-depth Cisco ISE Mastery Training, subscribe to my YouTube channel Network Journey and join my instructor-led classes for hands-on, real-world ISE experience
Closing Notes — Key takeaways
- Syslog (TLS) + Field Extraction is the foundation — it gives persistent events in SIEM.
- pxGrid + ERS add real-time enrichment and actionability (fetch session info, trigger CoA).
- Test early & collect evidence (logs, job IDs) — SOC will demand traceability.
- Tune verbosity to avoid noise; keep
Authentication/Authorization/Posture/CoAas high-priority channels. - Automate: SIEM playbooks should call ERS for enrichments and, after gating, can call ERS/ANC to contain.
Upgrade Your Skills – Start Today
For full, instructor-led Cisco ISE Mastery (hands-on labs, automation playbooks, pxGrid workflows, SIEM connector templates), subscribe to Network Journey on YouTube and enroll in the four-month CCIE-Security focused training.
The course covers ISE, pxGrid, TrustSec, FTD/FMC, SIEM integrations and automation. Course outline & enrollment: https://course.networkjourney.com/ccie-security/
Sign up to get the ISE→SIEM Runbook Pack (templates, Splunk props/transforms, QRadar DSM snippets, ArcSight connector config and ERS scripts).
Enroll Now & Future‑Proof Your Career
Email: info@networkjourney.com
WhatsApp / Call: +91 97395 21088
![[Day 20] Cisco ISE Mastery Training: Configuring Authorization Profiles](https://networkjourney.com/wp-content/uploads/2025/08/Day-20-Cisco-ISE-Mastery-Training-Configuring-Authorization-Profiles.png)