Trainer Sagar Dhawan
- Posted on
[Day 135] Cisco ISE Mastery Training: IoT & OT Device Profiling
Table of Contents
Introduction
IoT & OT devices (IP cameras, PLCs, medical devices, building management systems, printers, POS terminals) are everywhere — but they are not like laptops: they often lack modern identity controls, run legacy protocols, and may be unmanaged for years. That makes them the highest-risk assets for lateral movement and supply-chain attacks.
Why profiling matters: Cisco ISE’s profiler identifies what is on the network (device type, vendor, model, firmware when possible) so you can automatically classify, segment and apply the right authorization. For OT environments, this reduces human manual work, prevents accidental access to critical systems, supports compliance, and enables automated containment when required.
Teaching goal: by the end of this Article you will be able to build robust IoT/OT detection using multiple telemetry sources, create custom signatures for hard-to-detect devices, tie profiling to enforcement, and validate results with GUI, CLI and packet captures.
Problem Statement
Real-world problems we solve:
- Vendor diversity & legacy protocols: many OT devices don’t speak modern identity (no 802.1X, no SCEP, no MDM).
- Sparse telemetry: some devices don’t do DHCP or HTTP; others only appear via syslog or SNMP.
- Scale & speed: manual MAC whitelists don’t scale — need automatic classification.
- Safety & continuity: OT devices often control physical processes; profiling must be accurate and low-impact.
- Regulatory needs: asset inventory, firmware tracking and audit trails are required for compliance.
Solution Overview (how Cisco ISE helps)
ISE provides a Profiler service that ingests multiple telemetry sources (DHCP, HTTP User-Agent, RADIUS attributes, SNMP, DNS, syslog via Passive Identity Connector (PIC) or syslog collectors, and integrations with flow/visibility platforms) and evaluates Profiling Policies to assign Endpoint Type / Identity Group. Key solution elements:
- Multi-probe correlation: combine DHCP + HTTP + SNMP signals to increase confidence.
- Custom probes & regex extraction: parse vendor headers, syslog lines, or SNMP
sysDescrto extract model/firmware. - Passive Identity Connector (PIC)/syslog templates: capture vendor messages from firewalls/IDS and map to endpoints.
- Policy-driven enforcement: map profiled devices to Endpoint Identity Groups → Authorization Profiles (VLANs, dACLs, SGTs) → automated CoA to reassign sessions.
- Integration: pxGrid/REST APIs to feed SIEM/CMDB for live inventory and automation.
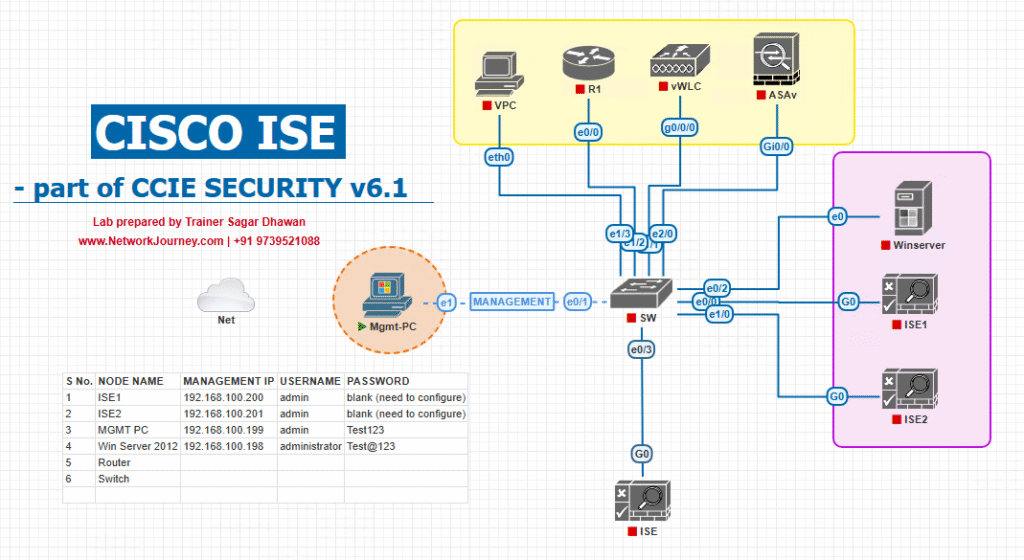
Sample Lab Topology
Platform: VMware (recommended) or EVE-NG.
VMs/Devices (example lab):
- Cisco ISE PAN + PSN (Profiler enabled) —
10.10.10.11(PSN) - DHCP server (Windows/Linux) —
10.10.20.10 - HTTP server (to capture User-Agent) —
10.10.30.20 - SNMP emulator (snmpsim) or physical OT device —
10.10.40.10 - Syslog generator (Node-RED or logger) → forward messages to PIC/ISE collector —
10.10.50.10 - Test endpoints: Linux VM for crafting custom traffic, Windows laptop, mobile device
- NAD (switch / WLC) in lab or emulated — sends RADIUS to ISE
IP Plan (example):
ISE PSN: 10.10.10.11
DHCP:    10.10.20.10
HTTP:    10.10.30.20
SNMP:    10.10.40.10
Syslog:  10.10.50.10
Client:  172.16.110.100
Topology Diagram:
Notes: Use snapshots. For syslog parsing you can run Node-RED or logger to generate sample vendor messages.
Step-by-Step GUI Configuration Guide (numbered; include CLI where useful)
Pre-req: ISE PSN has Profiler enabled. NTP in sync. Ensure network routing allows traffic from devices to PSN.
Step 1 — Enable Profiler service on PSN
- ISE GUI → Administration > System > Deployment → Edit PSN → enable Profiler service on the node.
[Screenshot: Deployment → Node Edit → Profiler checked]
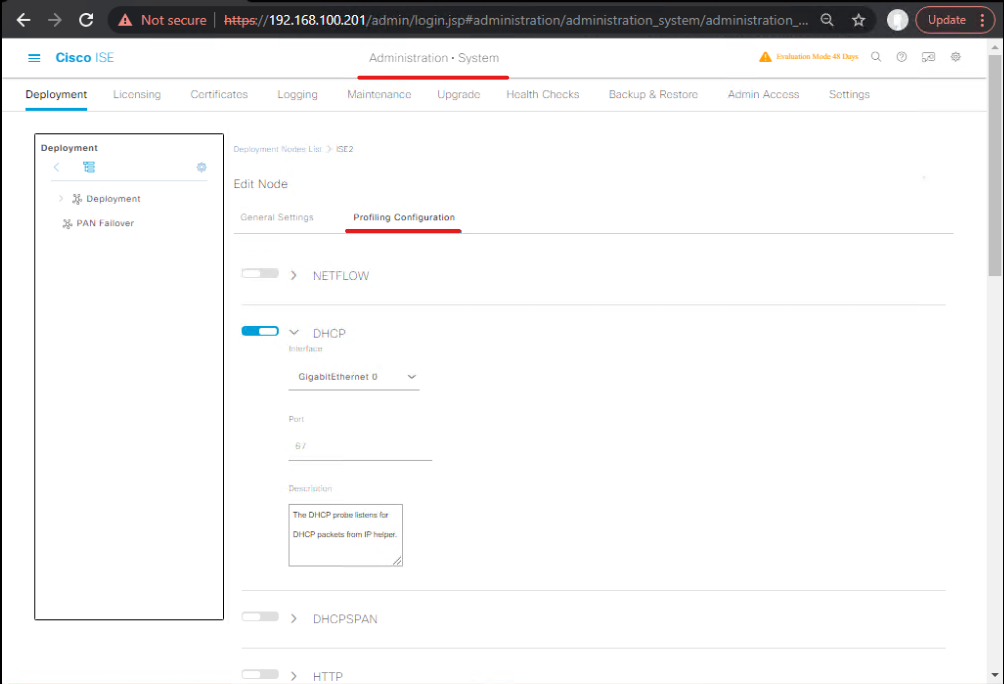
- Save → verify node shows Profiler enabled in Adminstration> System > Deployment.
Validation: Operations > System > Nodes shows PSN status; Profiler service should be UP.
Step 2 — Enable the probes you need
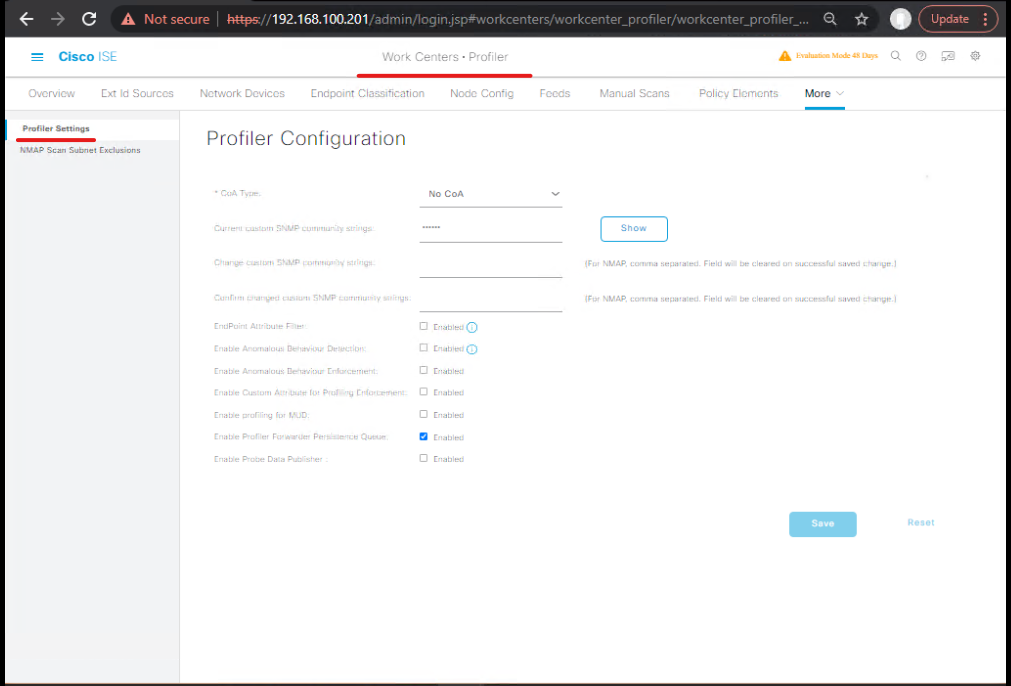
- ISE GUI → Work Centers > Profiler > Settings (or Administration > System > Settings > Profiling).
- Probes: enable DHCP, HTTP/HTTPS (User-Agent), SNMP, RADIUS, DNS, and Syslog / PIC integration. Save.
[Screenshot: Profiler Settings → Probes]
Validation: Start generating example DHCP/HTTP/SNMP traffic; open Operations > Profiler > Probe Activity and verify attributes arriving.
Step 3 — Add SNMP credentials (so ISE can poll)
- ISE GUI → Work Centers> Network Resources > Network Device Credentials → Add SNMPv2/v3 credential for your OT devices (community or user). [Screenshot: Add SNMP Credential]
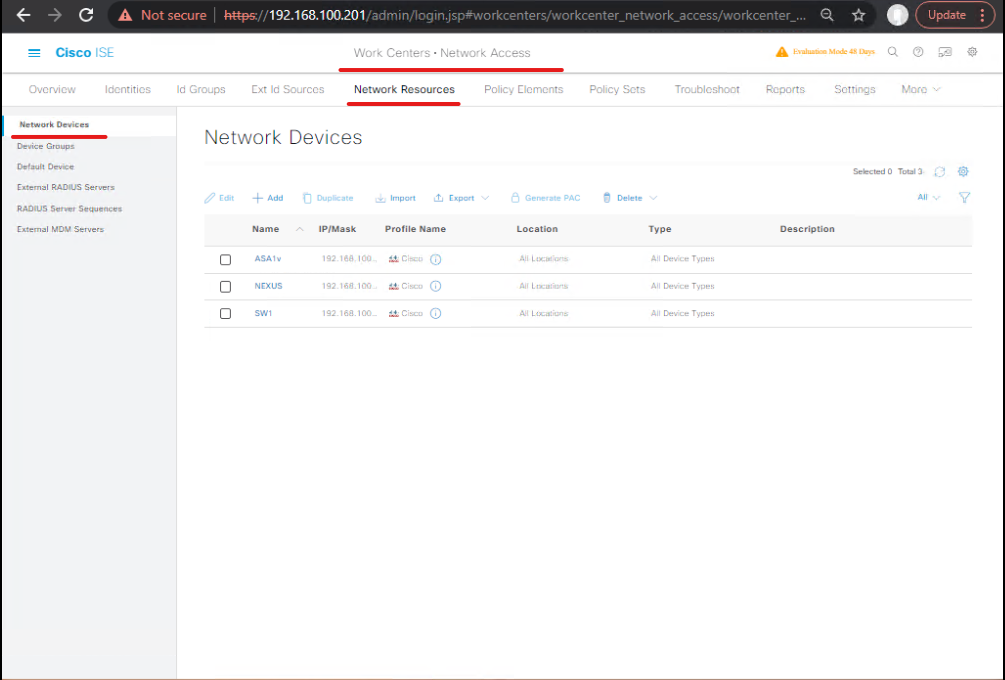
- For lab SNMP emulator, set community
public.
Validation: From an ISE shell (lab only) or from a management host run:
snmpwalk -v2c -c public 10.10.40.10 SNMPv2-MIB::sysDescr.0
# Expect sysDescr string (e.g., "Siemens SIMATIC S7-1200 ...")
Step 4 — Capture raw telemetry (test traffic to ensure probes see data)
A. DHCP test (DHCP Option 60)
Use scapy (Linux VM) to craft DHCPDISCOVER with Option 60:
# scapy test snippet (lab)
from scapy.all import *
dhcp = Ether(dst='ff:ff:ff:ff:ff:ff')/IP(src='0.0.0.0',dst='255.255.255.255')/UDP(sport=68,dport=67)/BOOTP()/DHCP(options=[('message-type','discover'), ('vendor_class_id','OT-Device-X'), 'end'])
sendp(dhcp, iface='eth0')
B. HTTP UA test
curl -A 'SiemensS7/2.3 (Model:S7-1200;FW:4.1.0)' http://10.10.30.20/
C. SNMP test
snmpwalk -v2c -c public 10.10.40.10 sysDescr
D. Syslog test
Use logger or Node-RED to send:
logger -n 10.10.10.11 -P 514 "vendor-ot: mac=00:11:22:33:44:55 model=S7-1200 fw=4.1.0"
Validation: Confirm ISE receives probe data: Operations > Profiler > Probe Activity.
Step 5 — Create Custom Profiling Rules (examples with regex)
Use case 1 — HTTP User-Agent extraction for Siemens S7
- ISE GUI → Policy > Policy Elements > Results > Profiling > Profiling Policies → Add rule
Siemens_S7_HTTP_UA.
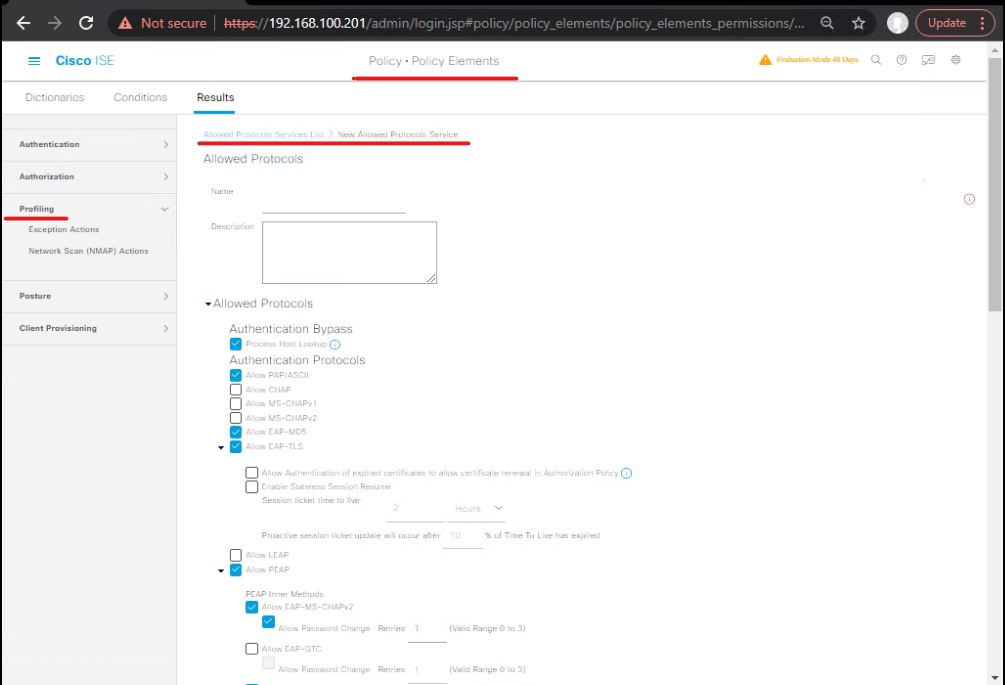
- Condition: HTTP Header → User-Agent matches regex:
^SiemensS7\/(?<swver>[0-9\.]+)\s+\(Model:(?<model>[^\;]+);\s*FW:(?<fw>[^\)]+)\)
- Action: Set Endpoint Type =
PLC (Siemens S7); set Custom Attributes:OT_Model = ${model},OT_FW=${fw}.
[Screenshot: Profiling Policy → Add Rule]

Validation: curl UA (see Step 4B), then Work Centers> Profiler > Endpoints → select endpoint → verify Endpoint Type and custom attributes.
Use case 2 — DHCP Option 60 match for building sensors
- Profiling rule: If
DHCP Option 60 contains 'BuildingSensorX'→ Endpoint Type =Building Sensor. - Save & put rule above generic rules.
Validation: send DHCP Option 60 (Step 4A) and check Profiler > Endpoints.
Use case 3 — SNMP sysObjectID / sysDescr match
- Profiling rule: If
SNMP sysDescr matches regex .*S7-1200.*orSNMP sysObjectID == .1.3.6.1.4.1.<vendorOID>→ set Endpoint Type =Siemens PLC. - Save.
Validation: snmpwalk (Step 4C) and confirm ISE captured SNMP attributes.
Use case 4 — Syslog template via PIC
- If you have PIC or syslog collector: create a PIC template that extracts MAC & model with a regex:
mac=(?P<mac>(?:[0-9A-Fa-f]{2}:){5}[0-9A-Fa-f]{2}).*model=(?P<model>\S+).*fw=(?P<fw>\S+)
- Map
mac→ Endpoint MAC,model→ CustomAttrOT_Model. [Screenshot: PIC Template Create → Map Groups]
Validation: send test syslog (Step 4D) and verify ISE endpoint created or updated with model.
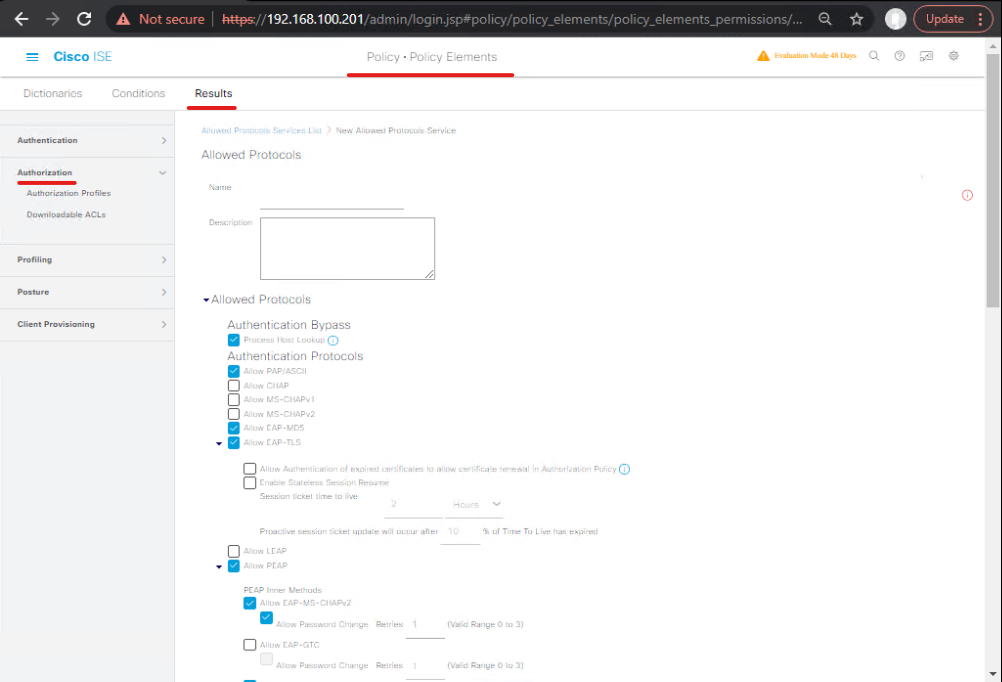
Step 6 — Map profiling outcome to identity groups & authorization
- ISE GUI → Policy > Policy Elements > Results > Authorization > Authorization Profiles → Create
OT_VLAN_Quarantine(Access Type = ACCESS_ACCEPT, set VLAN or dACL). [Screenshot: Authorization Profile Create]
- Policy Sets → Add rule: If
Endpoint Identity Group == OT/PLC→ applyOT_VLAN_QuarantineorOT_Restricted. Place high priority. [Screenshot: Policy Sets → Authorization Rule]
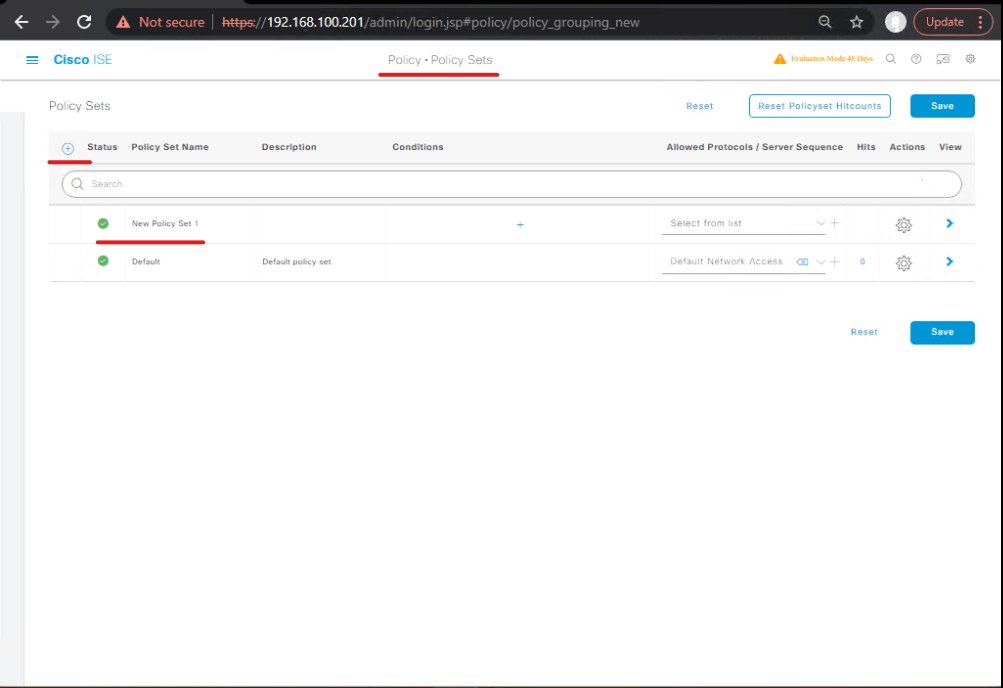
Validation: Simulate client connecting; check Operations > RADIUS > Live Logs to see Access-Accept with VLAN/ACL attributes. On switch: show authentication sessions interface Gi1/0/x details to confirm VLAN assignment.
Step 7 — Rescan / Force re-evaluation
- ISE GUI Operations > Profiler > Endpoints → select endpoint → choose Rescan/Resubmit to force the profiler to re-evaluate the new rules.
- Useful after rule changes to see immediate effect.
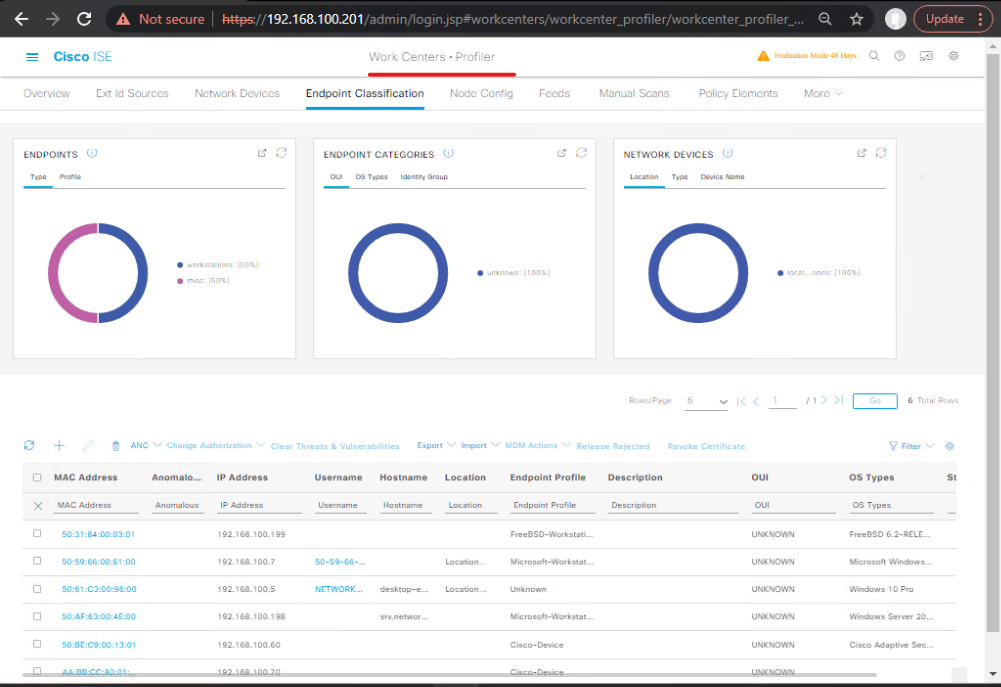
Validation: Endpoint re-evaluated and new Endpoint Type appears.
CLI & packet capture useful commands (lab)
- Capture HTTP UA and DHCP:
sudo tcpdump -i eth0 -w profiler_lab.pcap 'port 67 or port 68 or tcp port 80 or udp port 161 or port 514'
- SNMPwalk:
snmpwalk -v2c -c public 10.10.40.10 SNMPv2-MIB::sysDescr.0
- View ISE profiler logs (lab shell; use carefully):
# (ISE shell access is limited; use Operations UI where possible)
# but in lab if you have access:
show logging application profiler.log
Troubleshooting & Diagnostics
Use the three-lens approach: Raw probe data → Profiler decision → Network / NAD enforcement.
Quick checklist (ordered)
- Probe data present?
- GUI: Operations > Profiler > Probe Activity — do you see the incoming attributes?
- If missing: check network flow to PSN, device NAT/firewall, or whether traffic is mirrored to PSN.
- Regex not matching?
- Copy raw string from Probe Activity or PCAP. Test regex in an online/test tool using Java/PCRE flavor. Common errors: greedy
.*, wrong escaping, case sensitivity. Use(?i)for case-insensitive.
- Copy raw string from Probe Activity or PCAP. Test regex in an online/test tool using Java/PCRE flavor. Common errors: greedy
- Rule ordering issue?
- Profiling rules are top-down. Ensure your specific OT rule is above generic OS rules.
- Credential mismatch for SNMP polling?
- Test
snmpwalkusing ISE credential. If fail, adjust community or SNMPv3 settings.
- Test
- Endpoint cache/ageing
- Use Rescan to force re-evaluation. Also check profiler cache TTL in Profiler settings.
- False positives
- Require multi-probe match (DHCP + HTTP or SNMP + syslog) before final classification. Use multi-probe confidence settings.
- Enforcement mismatch
- If ISE reports correct group but switch did not apply VLAN: check NAD device entry & shared secret, check CoA configuration (dynamic authorization), and switch config.
Useful debugging commands
- On switch (Cisco example) after ISE Authorization accepted:
show authentication sessions interface Gi1/0/10 details
show access-lists
show running-config | inc radius
- For syslog/PIC processing: inspect collector logs and PIC template match logs.
Walkthroughs with Validation
Lab Walkthrough A — Identify Siemens PLCs (SNMP + HTTP UA) and segment them
- Enable SNMP + HTTP probes. Add SNMP credential
public. - Add profiling rules (see Step 5 examples).
- From client run:
curl -A 'SiemensS7/2.3 (Model:S7-1200;FW:4.1.0)' http://10.10.30.20/
snmpwalk -v2c -c public 10.10.40.10 sysDescr
- Force endpoint rescan. Confirm Endpoint Type
PLC (Siemens)in Profiler > Endpoints. - Confirm Authorization applied: Operations > RADIUS > Live Logs shows Access-Accept with VLAN/dACL. Validate on NAD:
show authentication sessions ....
Deliverables: screenshot of ISE endpoint attributes, tcpdump fragment showing UA, switch show authentication sessions.
Lab Walkthrough B — Syslog based detection of medical device, auto inventory
- Configure PIC or syslog collector and create regex template for vendor message (Step 5 PIC example).
- Send test syslog:
logger -n 10.10.10.11 -P 514 "medvendor: mac=00:11:22:AA:BB:CC model=MedScanX serial=SN999 fw=2.2.2"
- Verify ISE created endpoint with
OT_Model=MedScanX, and that asset exported to CMDB via pxGrid (if configured). - Apply Authorization rule to put medical devices on
MEDICAL_VLANand restrict internet.
Expert Level Use Cases (step-by-step mapping + validation)
Use Case 1 — Auto-segmentation of OT devices at onboarding
- Profile device via DHCP Option 60 or SNMP.
- Assign Endpoint Identity Group
OT/SegmentA. - Authorization Profile applies
OT_VLANand restricted dACL. - Automatically send CoA if device initially connected unclassified.
Validation: connect new device, confirm endpoint moves to OT VLAN and traffic blocked to corp net.
Use Case 2 — Firmware tracking & vulnerability batching
- Extract firmware from UA/syslog into custom attribute
OT_FW. - Export endpoint inventory weekly → filter by
OT_FWolder than X → feed SIEM/patching workflow.
Validation: exported CSV showsOT_FWcolumn; SIEM receives asset list.
Use Case 3 — SOC automated containment
- SIEM detects suspicious behavior on endpoint → calls orchestration which uses pxGrid/ISE API to set endpoint to
Quarantine. - ISE issues CoA to NAD to move device to
Quarantine VLAN.
Validation: CoA logs show CoA-Request and NAD performs VLAN change.
FAQs – IoT & OT Device Profiling in Cisco ISE
Q1. How does Cisco ISE differentiate between IT devices and IoT/OT devices during profiling?
Answer: Cisco ISE uses multiple probes (DHCP, RADIUS, SNMP, NetFlow, NMAP, HTTP, CoA) to collect contextual attributes like DHCP options, MAC OUI, HTTP headers, SNMP sysDescr, and NetFlow traffic patterns. IoT devices typically lack 802.1X support and have deterministic communication patterns, making profiling easier with MAC OUI and behavior signatures. OT devices often require custom profiling policies based on vendor-specific attributes (e.g., Rockwell Automation, Siemens PLCs).
Q2. What are the common challenges in profiling IoT/OT devices in a NAC environment?
Answer:
- Lack of 802.1X/EAP support
- Hardcoded or legacy OS stacks with limited attributes
- Devices using static IP addresses (no DHCP probes)
- Vendor-specific non-standard protocols (Modbus, BACnet, Profinet)
- Critical devices that cannot tolerate downtime for testing/CoA
Q3. Which ISE probes are most effective for IoT/OT device profiling?
Answer:
- DHCP Probe → Extracts DHCP option fields (vendor class identifier, client identifier).
- SNMP Probe → Useful for profiling industrial switches, controllers, and OT endpoints.
- RADIUS Probe → Identifies device class via calling-station-ID and NAS info.
- NetFlow Probe → Recognizes devices by their application traffic (e.g., Modbus TCP).
- NMAP Probe → Detects OS fingerprint and open ports for deeper validation.
Q4. Can IoT/OT devices be profiled without using DHCP attributes?
Answer: Yes. While DHCP is most common, you can use SNMP queries, MAC OUI databases, custom profiling conditions (like TCP port scans for Modbus TCP 502), or integrate with external MDM/asset databases. For static IP OT devices, SNMP + NetFlow are most effective.
Q5. How does ISE handle legacy OT devices with no authentication support?
Answer: Such devices typically use MAB (MAC Authentication Bypass) with profiling. The MAC address is matched against profiling policies, and ISE assigns a specific VLAN/Security Group Tag (SGT). Policies are built to restrict OT devices into segmented VLANs or TrustSec SGTs to minimize risk exposure.
Q6. Can we integrate Cisco ISE profiling with external IoT visibility platforms?
Answer: Yes. ISE supports pxGrid integration with tools like Cisco Cyber Vision, Forescout, Armis, Nozomi Networks, which provide enriched context about IoT/OT devices. These integrations improve profiling accuracy and allow automated policy enforcement.
Q7. How do we validate if IoT/OT profiling in ISE is accurate?
Answer:
- Navigate to Operations > RADIUS > Live Sessions in ISE GUI.
- Check Endpoints > Identity > Attributes to view the profiling policy matched.
- Validate attributes like DHCP class, OUI, SNMP sysDescr, open ports.
- Cross-verify with external inventory systems (if available).
- Perform controlled traffic capture (SPAN/Wireshark) to confirm patterns.
Q8. What precautions should be taken before applying profiling policies to production OT environments?
Answer:
- Avoid aggressive CoA (Change of Authorization) that may disrupt OT traffic.
- Start with monitor-only VLANs before enforcing restrictions.
- Test profiling with lab replicas or digital twins of OT devices.
- Always have a fail-open policy for critical OT devices during initial rollout.
Q9. Can profiling detect rogue or fake IoT devices in the network?
Answer: Yes, partially. ISE profiling detects anomalies when device attributes don’t match the expected signature. For example, if a device spoofs an IP/MAC but does not generate expected traffic (e.g., BACnet for building automation), ISE can flag it. However, profiling is not foolproof against advanced spoofing, so supplement with anomaly detection platforms.
Q10. How can profiling be automated to reduce manual effort in large IoT/OT networks?
Answer:
- Use Profiling Policies + Identity Groups to auto-classify devices.
- Enable Adaptive Network Control (ANC) to dynamically quarantine suspicious IoT devices.
- Integrate pxGrid with Cisco DNA Center or Cyber Vision for automated inventory sync.
- Use profiling feeds from Cisco ISE feed service for updated IoT vendor signatures.
YouTube Link
For more in-depth Cisco ISE Mastery Training, subscribe to my YouTube channel Network Journey and join my instructor-led classes for hands-on, real-world ISE experience
Closing Notes (key takeaways)
- IoT & OT profiling is multi-signal: combine DHCP, HTTP, SNMP, syslog and flow to obtain high confidence.
- Custom probes and PIC enable detection of devices that the out-of-box profiler misses.
- Always test in lab, prefer passive collection for OT, and design enforcement with safety/rollback in mind.
- Operationalize: export inventory, integrate with CMDB/SIEM (pxGrid), and automate containment for incidents.
Upgrade Your Skills — Start Today
For hands-on Cisco ISE mastery, subscribe to Network Journey on YouTube and join my instructor-led Fast-Track to Cisco ISE Mastery Pro (4 months). Live labs, weekly troubleshooting sessions, EVE-NG/VMware labpacks, and CCIE-style scenarios: https://course.networkjourney.com/ccie-security/
Fast-Track to Cisco ISE Mastery Pro — 4 months of live instructor-led labs.
Reserve your seat and get the IoT & OT Profiling labpack (EVE-NG topology + runbook)
Enroll Now & Future‑Proof Your Career
Email: info@networkjourney.com
WhatsApp / Call: +91 97395 21088