![[Day #23 PyATS Series] Interface Error Counters Monitoring Using pyATS for Cisco](https://networkjourney.com/wp-content/uploads/2025/07/Interface-error-counters-monitoring.png)
Trainer Sagar Dhawan
- Posted on
[Day #23 PyATS Series] Interface Error Counters Monitoring Using pyATS for Cisco [Python for Network Engineer]
Table of Contents
Introduction
Monitoring interface error counters is crucial in maintaining a healthy network. Errors such as input drops, CRC errors, and collisions can significantly degrade performance and lead to network outages. Traditionally, network engineers manually run show interfaces commands on each device to track these errors—a tedious and error-prone process. With pyATS, we can automate interface error counter monitoring across multiple Cisco devices, ensuring proactive troubleshooting and rapid fault detection.
This guide is designed for Python for Network Engineer learners who want to build scalable monitoring solutions. By the end, you’ll have a script that collects, analyzes, and reports interface errors across your Cisco infrastructure, enabling proactive network health management.
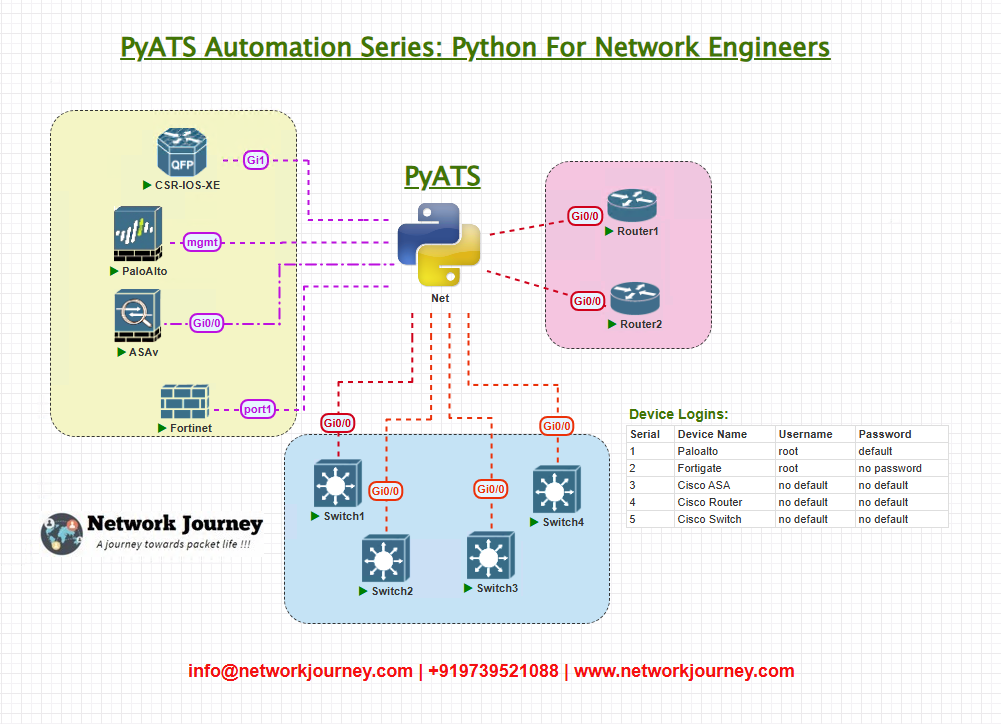
Topology Overview
We’ll demonstrate this on a simplified topology:
- Router1 – Cisco ISR4431 (Core router)
- Switch1 – Cisco Catalyst 9300 (Distribution)
- Switch2 – Cisco Catalyst 9200 (Access)
- Firewall1 – Cisco ASA 5506-X
Our goal is to monitor error counters across all network interfaces, report anomalies, and store results for historical tracking.
Topology & Communications
- Protocol: SSH for all Cisco devices
- Authentication: Managed via
testbed.yml - Libraries: pyATS Genie for parsing
show interfacescommand
The script will:
- Connect to each device
- Parse
show interfacesoutput - Identify interfaces with non-zero error counters (e.g., CRC errors, drops)
- Generate a structured report (JSON/CSV)
- Optionally, trigger alerts if thresholds are exceeded
Workflow Script
from genie.testbed import load
import json

def get_interface_errors(device):
    device.connect(log_stdout=False)
    output = device.parse('show interfaces')
    device.disconnect()
    errors = {}

    for intf, details in output.items():
        input_errors = details.get('counters', {}).get('in_errors', 0)
        output_errors = details.get('counters', {}).get('out_errors', 0)
        crc_errors = details.get('counters', {}).get('in_crc_errors', 0)

        if input_errors > 0 or output_errors > 0 or crc_errors > 0:
            errors[intf] = {
                'input_errors': input_errors,
                'output_errors': output_errors,
                'crc_errors': crc_errors
            }

    return errors

if __name__ == "__main__":
    testbed = load('testbed.yml')
    devices = testbed.devices
    error_report = {}

    for name, device in devices.items():
        print(f"Checking interface errors on {name}...")
        error_report[name] = get_interface_errors(device)

    with open('interface_error_report.json', 'w') as f:
        json.dump(error_report, f, indent=4)

    print(json.dumps(error_report, indent=4))
Explanation by Line
- Imports: Load testbed and JSON for structured output.
- get_interface_errors():
- Connects to device
- Parses
show interfacesinto a dictionary - Extracts
in_errors,out_errors, andin_crc_errors - Flags interfaces where any error counter > 0
- Main block:
- Iterates over all devices in testbed
- Collects and stores results in JSON file
This modular design can easily be extended to track other counters like packet drops or overruns.
testbed.yml Example
testbed:
  name: interface_error_monitoring
  devices:
    Router1:
      os: iosxe
      type: router
      connections:
        cli:
          protocol: ssh
          ip: 192.168.100.1
      credentials:
        default:
          username: admin
          password: cisco123

    Switch1:
      os: iosxe
      type: switch
      connections:
        cli:
          protocol: ssh
          ip: 192.168.100.2
      credentials:
        default:
          username: admin
          password: cisco123

    Switch2:
      os: iosxe
      type: switch
      connections:
        cli:
          protocol: ssh
          ip: 192.168.100.3
      credentials:
        default:
          username: admin
          password: cisco123

    Firewall1:
      os: asa
      type: firewall
      connections:
        cli:
          protocol: ssh
          ip: 192.168.100.4
      credentials:
        default:
          username: admin
          password: asa123
Post-validation CLI Screenshots (Expected Output)
Sample CLI:
Switch1# show interfaces
GigabitEthernet1/0/1 is up, line protocol is up
  Hardware is Gigabit Ethernet
  Input errors: 12, CRC: 5
  Output errors: 0
Script Output:
{
    "Switch1": {
        "GigabitEthernet1/0/1": {
            "input_errors": 12,
            "output_errors": 0,
            "crc_errors": 5
        }
    }
}
This shows that Gi1/0/1 has input and CRC errors, which need further investigation.
FAQs
1. What specific interface errors does this script detect?
The script detects input errors, output errors, and CRC errors. You can easily extend it to include additional counters like frame errors, overruns, or dropped packets.
2. Can I customize error thresholds for alerts?
Yes. You can add logic to define custom thresholds (e.g., more than 100 CRC errors triggers an alert) and integrate with notification systems like email, Slack, or Teams.
3. Does this solution work on devices running different Cisco platforms (IOS, IOS-XE, ASA)?
Yes. The script works with Cisco IOS, IOS-XE, and ASA devices as long as they support the show interfaces command and pyATS provides a parser for it.
4. How can I track historical trends of interface errors?
By running the script periodically and saving outputs to a database (e.g., SQLite, PostgreSQL), you can visualize long-term error trends using tools like Grafana or Kibana.
5. Can this script be extended to support non-Cisco devices?
Absolutely. pyATS has vendor-agnostic capabilities. You can add parsing commands for Arista, Juniper, Palo Alto, and other platforms to create a unified multi-vendor monitoring tool.
6. Is the script safe to run in production networks?
Yes. The script is read-only and uses only show commands, ensuring no configuration changes are made to production devices.
7. How scalable is this for large environments with hundreds of devices?
pyATS supports parallel connections and can handle hundreds of devices efficiently. For very large deployments, you can distribute the script across multiple workers or integrate it into a job scheduler.
8. How can I add automated remediation if errors exceed thresholds?
You can extend the script to automatically trigger Ansible playbooks or Python scripts that reset interfaces or open a ticket in your ITSM system whenever error counts surpass predefined limits.
YouTube Link
Watch the Complete Python for Network Engineer: Interface Error Counters Monitoring Using pyATS for Cisco [Python for Network Engineer] Lab Demo & Explanation on our channel:
Join Our Training
Proactively monitoring error counters is key to maintaining a stable network. Trainer Sagar Dhawan offers a 3-month instructor-led course covering Python, Ansible, APIs, and Cisco DevNet for Network Engineers. Learn to automate monitoring, validation, and troubleshooting with hands-on projects.
Join the Training Here and elevate your skills with Python for Network Engineer expertise to secure your future in network automation.
Enroll Now & Future‑Proof Your Career
Email: info@networkjourney.com
WhatsApp / Call: +91 97395 21088
![[Day #100 PyATS Series] Production-Grade Automation Audit Reports for Management Using pyATS for Cisco [Python for Network Engineer]](https://networkjourney.com/wp-content/uploads/2025/09/Day-100-PyATS-Series-Production-Grade-Automation-Audit-Reports-for-Management-Using-pyATS-for-Cisco-Python-for-Network-Engineer-470x274.png)
![[Day#3 PyATS Series] Installing pyATS & Genie (core, NX-OS, IOS-XR plugins) using pyATS for Cisco](https://networkjourney.com/wp-content/uploads/2025/07/Day3-PyATS-Series-Installing-pyATS-Genie-core-NX-OS-IOS-XR-plugins-using-pyATS-for-Cisco_networkjouney.png)