[Day 29] Cisco ISE Mastery Training: Using Reports for Wired Authentication Analysis
Table of Contents
Introduction
Reports are where data becomes insight. Cisco ISE collects massive amounts of authentication and endpoint telemetry — Live Logs are great for one-off troubleshooting, but reports let you analyze trends, measure SLA/uptime, quantify authentication failure causes, spot rogue devices, and produce audit evidence for security/compliance teams.
For wired authentication analysis you’ll use ISE reports to answer business and operational questions such as:
- Which switch/port/NAS has the most auth failures this week?
- Are failures caused by EAP-TLS cert issues, bad passwords, or AD lookups?
- How many devices are authenticating by 802.1X vs MAB (and are these proportions changing)?
- Which endpoints got placed in quarantine/guest VLANs in the last 24 hours?
This lesson shows you how to build, run, schedule, export, validate and automate reports for wired auth in ISE — with exact step-by-step GUI actions, useful CLI checks for cross-validation, and diagnosis steps when data looks inconsistent.
Problem Statement
Operational teams face these real problems every day:
- Too many one-off Live Log searches. You need repeatable, scheduled reporting for trending and SLAs.
- Lack of high-quality metrics. You can’t measure “auth failure root causes” without aggregated data.
- Auditing & compliance. Security audits require historic reports (PDF/CSV) showing who accessed what and when.
- Mass troubleshooting. When authentication problems span many users or sites you must quickly isolate the root cause by analyzing aggregated reports.
Manual ad-hoc analysis is slow and error-prone. Reports let you scale diagnostics, build historical baselines, and hand auditors concrete evidence.
Solution Overview
Cisco ISE provides:
- Built-in reports (Authentication Summary, Authentication Failures, Endpoint Admission, Top NAS, etc.) for common analysis.
- Custom report builder so you can create targeted reports (e.g., “MAB successes by switch by day”).
- Scheduling & export (CSV/PDF) and email delivery (SMTP) for automated distribution.
- Integration points (syslog/SIEM and APIs) for long-term analytics and correlation.
By combining Live Logs (real-time) with scheduled reports (historical/trending), you get both forensic detail and operational overview.
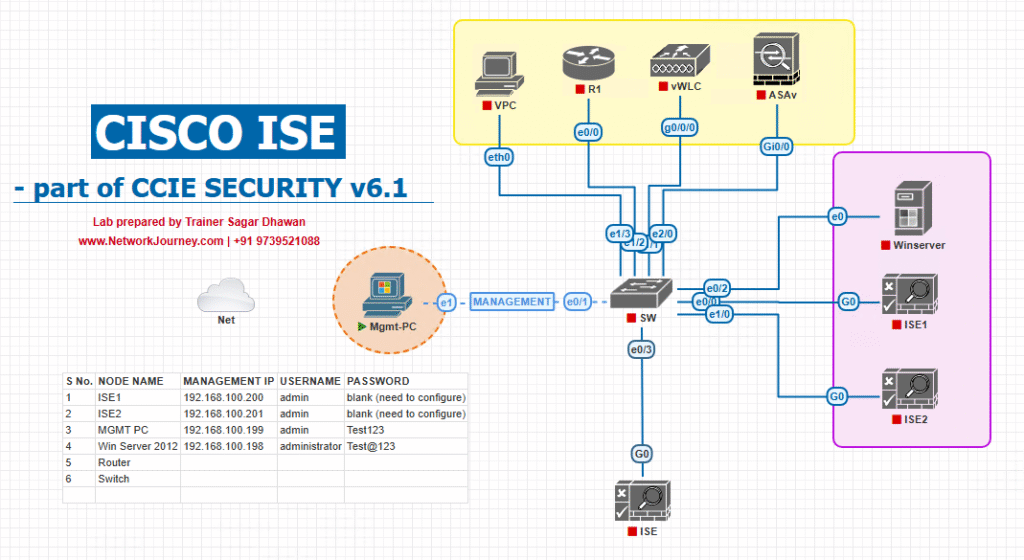
Sample Lab Topology
Platform: VMware Workstation or EVE-NG
Node list for the lab:
- Cisco ISE VM (single node, v3.x) — 10.10.10.50
- Catalyst switch (IOS XE) — 10.10.10.2
- Windows AD/DHCP — 10.10.10.10
- rsyslog/SIEM (optional) — 10.10.10.100
- Windows 10 client (802.1X) — connected to Gi1/0/10
- Printer (MAB) — connected to Gi1/0/11
Topology diagram:

[rsyslog/SIEM]
Use this lab to generate authentication events (802.1X successes/failures, MAB flows) and then practice building and validating reports.
Step-by-Step GUI Configuration Guide (numbered with placeholders)
Pre-reqs: ISE time must be NTP-synced, ISE node must have Reporting service enabled, and SMTP (for scheduled email) configured if you want distribution.
Step 0 — Verify prerequisites
- NTP: ensure ISE, switches and syslog have synced time. (Admin GUI → System → NTP or check switch
show ntp status.) - Ensure ISE has Operations → Reports menu available (reporting role enabled).
- (Optional) Configure SMTP on ISE for scheduled report emailing: Administration → System → Settings → SMTP.
[Screenshot: ISE Admin SMTP Settings]
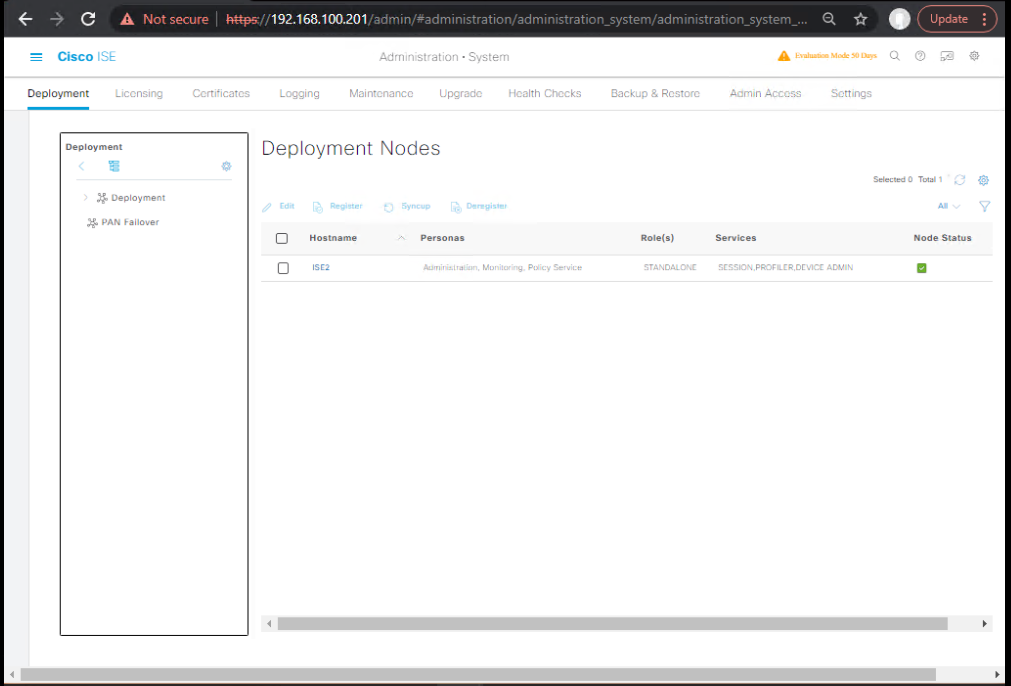
Step 1 — Confirm Reporting Service is running
- ISE GUI → Administration → System → Deployment.
- Click the node and confirm the Reporting service (or “Report” role) is enabled on at least one PSN/PAN node. If not, enable and save.
[Screenshot: ISE Deployment → Node Services]

Validation: After enabling, allow a few minutes and check Operations → Reports menu loads without error.
Step 2 — Run a Built-in Report (quick wins)
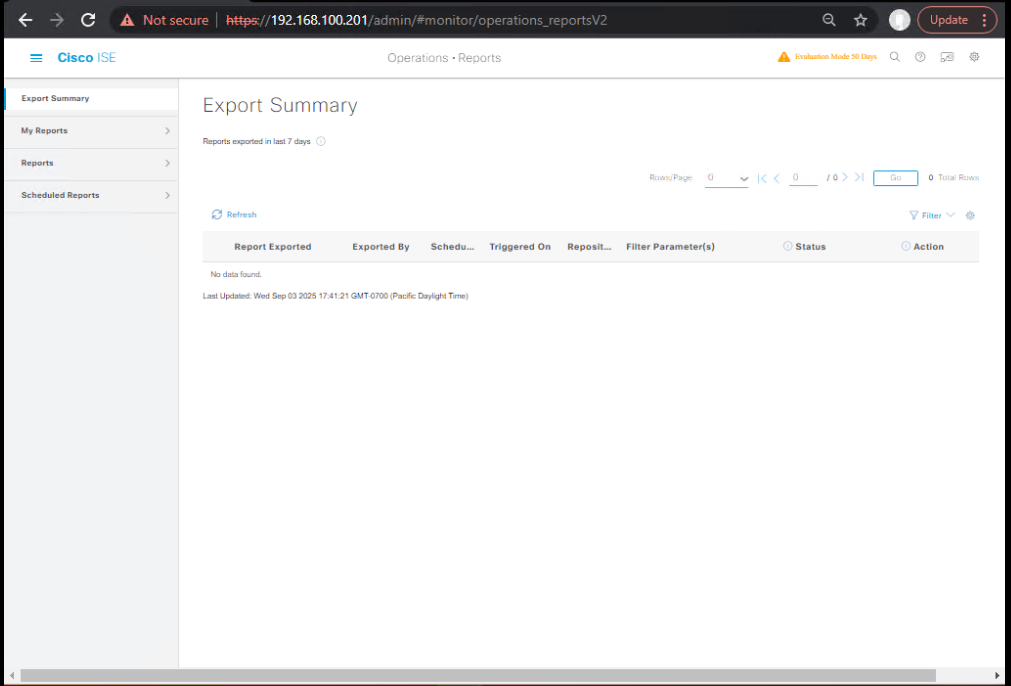
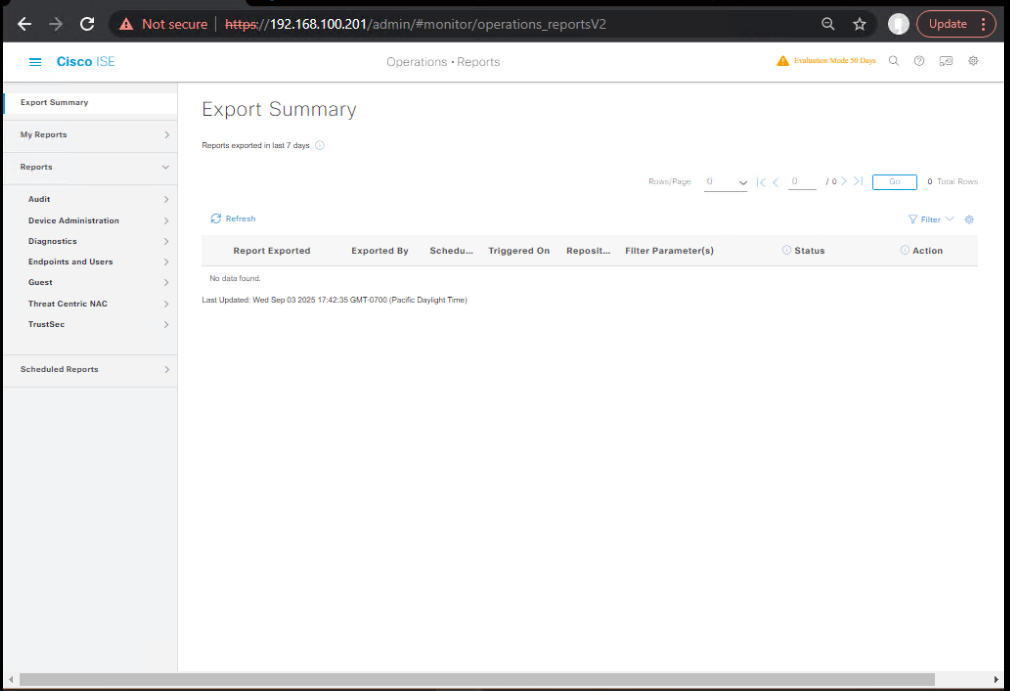
- ISE GUI → Operations → Reports (or Operations → RADIUS/Reports → Reports depending on release).
- Open Authentication Summary or Authentication Failures.
- Set Time Range (Last 24 hours / Last 7 days), Access Type = Wired, or filter by NAS-IP-Address to limit to a specific switch.
- Click Run.
[Screenshot: ISE Reports → Authentication Summary → Run]

What to look for: Total requests, success vs fail ratios, top failure reasons, top NAS devices causing failures.
Step 3 — Create a Custom Report (example: “Top 20 Auth Failures by Reason for Wired”)
- ISE GUI → Operations → Reports → Custom Reports → Create New.
[Screenshot: Reports → Custom Reports → Create]

- Name:
Wired_Failures_By_Reason - Data Source / Report Type: Choose
Authentication EventsorRADIUS / Auth Logas the data source (drop-down in builder). - Filters:
TimeRange= Last 7 daysAccessType= WiredResult= FAILURE
- Columns:
Timestamp,NAS-IP-Address,Calling-Station-Id(MAC),UserName,FailureReason,IdentitySource - Group By / Aggregate: Group by
FailureReason, order byCOUNT DESC, limit top 20. - Visualization: Table + Bar chart.
- Save and Run.
[Screenshot: Custom Report Builder — Filters & Columns]
Validation: Confirm the top reasons match quick Live Logs queries (see validation steps below).
Step 4 — Schedule the Custom Report (email delivery)
- Open saved report → click Schedule.
- Configure: Frequency (Daily @ 06:00), Format (CSV or PDF), Recipients (email addresses), Retention (keep last X runs).
- If SMTP is configured, save schedule. ISE will now email the report on cadence.
[Screenshot: Schedule Report dialog]
Validation: Verify email delivery; check the attachment format and column data for correctness.
Step 5 — Export / Download a Report Manually
- After running a report, click Export → choose CSV or PDF.
- Open CSV in Excel and verify columns, timestamps, and encoding.
[Screenshot: Export report as CSV]
Validation: Compare counts in CSV with ISE Live Logs (export matching timeframe).
Step 6 — Example: Create a “802.1X vs MAB Trend” report
- Custom Report → Data Source: Authentication Events.
- Filters:
TimeRange=Last 30 Days,AccessType=Wired. - Columns:
Date,AuthMethod(dot1x / mab),COUNT. - Group by
Date, split byAuthMethod→ produce stacked area chart to show trend. - Save & schedule weekly.
[Screenshot: Trend report Chart]
Use case: Spot rising MAB usage (may reveal rising number of non-supplicant devices).
Step 7 — Cross-validate with CLI & Live Logs (important)
On the switch (CLI)
- Check authentication sessions and RADIUS counters:
show authentication sessions interface Gi1/0/10 details
show radius statistics
show accounting
On ISE (GUI)
- Operations → RADIUS → Live Logs — search same time window and MAC/username. Compare number of Access-Requests and Access-Accept/Reject counts to the report totals.
Example validation steps:
- If the report shows 120 failures last 24h for NAS 10.10.10.2, run
show radius statisticson that switch and confirm number of requests in same period. Then filter ISE Live Logs for NAS-IP=10.10.10.2 and time range to confirm the report aggregated correctly.
Step 8 — Automate extraction via API (optional / advanced)
ISE supports programmatic access to reporting via REST APIs (varies by version). Typical flow:
- Use ISE API to request a report or download saved report runs.
- Automate ingestion into analytics pipelines (ELK/Splunk) for custom dashboards.
Note: Syntax and endpoints vary by ISE version — consult ISE API docs. (If you want, I can provide example curl snippets for your ISE version.)
Step 9 — Retention & Archival
- ISE GUI → Administration → System → Logging (or Reports retention settings) — configure how long report data is retained and where logs are archived.
- For regulatory needs, schedule reports to be stored in a central file share or SIEM.
Validation: Check that historical reports are accessible for the required retention window.
Step 10 — Troubleshooting report omissions or discrepancies
If a report is missing data or numbers don’t add up:
- Confirm time filters & timezone settings (ISE GUI vs viewer local timezone).
- Check ISE Live Logs to see if events exist for that timeframe.
- Ensure the Reporting service/node is healthy (Administration → System → Deployment).
- For distributed ISE, ensure DB replication and reporting node connectivity are healthy (sync indicators in GUI).
- If scheduled email fails, check SMTP server logs and ISE SMTP settings.
FAQs — Reports for Wired Auth Analysis
1. Q — What’s the difference between Live Logs and Reports?
A: Live Logs are real-time, event-level, for immediate forensic analysis. Reports are aggregated/historical, intended for trends, KPIs, and scheduled distribution. Use Live Logs to verify an event; use Reports to quantify and trend events.
2. Q — How do I report only on wired traffic?
A: In the report filters, set Access Type = Wired or filter by NAS-IP-Address/NAS-Identifier referencing your wired switches.
3. Q — Can I include custom fields (like site, building, or switch logical name) in reports?
A: Yes — add columns such as NAS-IP and map NAS-IP → Site via static mapping in your internal records, or add a custom attribute in ISE network device entries (device groups) and include that attribute in the report.
4. Q — How do I schedule and email reports?
A: Configure SMTP in ISE (Administration → System → Settings → SMTP), then schedule a saved report (Reports → Saved → Schedule) with recipients and format (CSV/PDF).
5. Q — Why do my report numbers not match the switch show radius statistics exactly?
A: Possible causes: timezone mismatch, different time windows, RADIUS retries counted differently, or packet loss between NAD and ISE. Always align timestamps (NTP sync) and compare exact time ranges.
6. Q — Can I export reports in CSV for downstream analytics?
A: Yes — reports can be exported as CSV and imported into Excel, ELK, or Splunk. For automation, use ISE REST APIs or scheduled email CSV attachments.
7. Q — How granular can custom reports be?
A: Very granular — you can filter by NAS, port, username, MAC, identity source, authentication method (PEAP/EAP-TLS/MAB), result reason, and time range. Use grouping/aggregation for summary metrics.
8. Q — How do I create a report for “Top 10 failure reasons by NAS”?
A: Build a custom report using Authentication Events as data source, filter AccessType=Wired, Result=Failure, group by NAS-IP and FailureReason and sort by COUNT DESC. Save & schedule.
9. Q — Can non-admins run reports?
A: Yes — assign report access to roles in ISE (Admin/Read-only roles). Use RBAC to restrict who can create, run, or schedule reports.
10. Q — Should I use ISE reports or SIEM for long-term analytics?
A: Use both: ISE reports are convenient for quick trending and audits; forward logs to SIEM for long-term storage, correlation across systems, alerting, and custom dashboards.
YouTube Link
For more in-depth Cisco ISE Mastery Training, subscribe to my YouTube channel Network Journey and join my instructor-led classes for hands-on, real-world ISE experience
Closing Notes — Key takeaways
- Reports turn event noise into actionable insight. Use them to measure auth health, identify root causes, and provide audit artifacts.
- Always validate report outputs against Live Logs and device CLI outputs for confidence.
- Automate: schedule reports to the right stakeholders (NOC, SecOps), and export CSVs for downstream analytics.
- Retain & archive historical reports for compliance.
- Use RBAC to control who can view and schedule reports.
Fast-Track to Cisco ISE Mastery Pro
Want to build production-grade reporting & monitoring for Cisco ISE, plus learn advanced troubleshooting, automation, and operational runbooks? Join in the 4-month Instructor-Led CCIE Security & ISE Mastery Program. This course includes:
- Hands-on labs (VMware/EVE-NG), step-by-step labs like this one
- Prebuilt report templates for wired/wireless auth analytics
- Live troubleshooting sessions and career coaching
- Lifetime access to recordings & lab guides
Enroll / View Course Outline: https://course.networkjourney.com/ccie-security/
Enroll Now & Future‑Proof Your Career
Email: info@networkjourney.com
WhatsApp / Call: +91 97395 21088
![[Day 29] Cisco ISE Mastery Training: Using Reports for Wired Authentication Analysis](https://networkjourney.com/wp-content/uploads/2025/08/Day-29-of-150-Cisco-ISE-Mastery-Training-Using-Reports-for-Wired-Auth-Analysis.png)


