![[Day #38 PyATS Series] CPU & Memory Utilization Monitoring Using pyATS for Cisco [Python for Network Engineer]](https://networkjourney.com/wp-content/uploads/2025/08/Day-38-PyATS-Series-CPU-Memory-Utilization-Monitoring-Using-pyATS-for-Cisco-Python-for-Network-Engineer.png)
Trainer Sagar Dhawan
- Posted on
[Day #38 PyATS Series] CPU & Memory Utilization Monitoring Using pyATS for Cisco [Python for Network Engineer]
Table of Contents
Introduction
Monitoring CPU and memory utilization is crucial for ensuring optimal network device performance and avoiding outages. High CPU or memory usage can indicate problems like excessive traffic, misconfigured processes, or hardware limitations. Traditionally, engineers manually check each device using CLI commands, which is tedious and error-prone.
In this post, part of our 101 Days of pyATS (Vendor-Agnostic) series, Trainer Sagar Dhawan demonstrates how to automate CPU and memory utilization monitoring using pyATS. This article is tailored for learners of Python for Network Engineer, showing how to:
- Collect CPU and memory statistics across multiple Cisco devices
- Automate health checks
- Generate reports to identify bottlenecks
- Scale monitoring in production environments
By the end, you will have a reusable pyATS solution to proactively track device health.
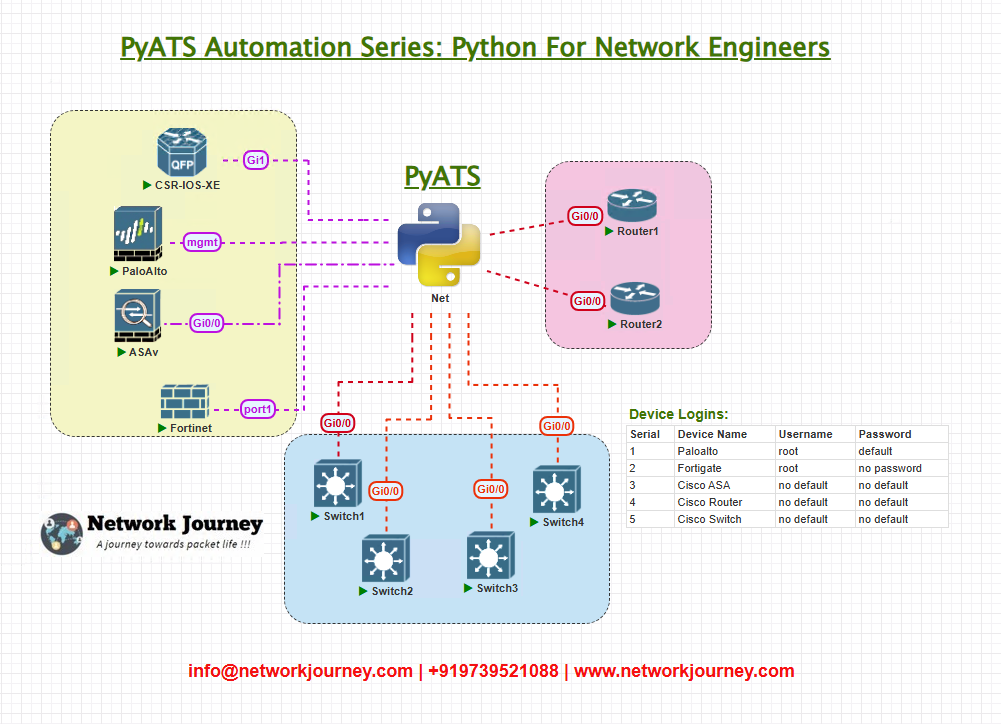
Topology Overview
Our lab includes three Cisco devices connected via Layer 3 links:
- R1, R2, and R3
- Goal: Collect CPU and memory usage from each device simultaneously
Topology & Communications
- Protocol: SSH-based CLI connections
- Commands used:
show processes cpu,show processes memory - Steps:
- Connect to each router using pyATS
- Parse CPU and memory usage
- Generate a health report highlighting overutilization
Workflow Script
from genie.testbed import load
import json

def get_device_utilization(device):
    device.connect(log_stdout=False)
    cpu_output = device.parse('show processes cpu')
    mem_output = device.parse('show processes memory')
    device.disconnect()

    cpu_util = cpu_output['five_sec_cpu_total']
    mem_total = mem_output['memory_summary']['total']
    mem_used = mem_output['memory_summary']['used']
    mem_util = (mem_used / mem_total) * 100

    return {
        'cpu_utilization': cpu_util,
        'memory_utilization': round(mem_util, 2)
    }

if __name__ == "__main__":
    testbed = load('testbed.yml')
    report = {}

    for name, device in testbed.devices.items():
        print(f"Collecting CPU & Memory data from {name}...")
        report[name] = get_device_utilization(device)

    with open('cpu_memory_report.json', 'w') as f:
        json.dump(report, f, indent=4)

    print(json.dumps(report, indent=4))
Explanation by Line
- get_device_utilization: Connects to each device, parses CPU and memory outputs.
- CPU Utilization: Extracts 5-second average CPU usage.
- Memory Utilization: Calculates used memory percentage.
- Output: JSON report of utilization per device.
testbed.yml Example
testbed:
  name: cpu_memory_test
  devices:
    R1:
      os: iosxe
      type: router
      connections:
        cli:
          protocol: ssh
          ip: 192.168.101.11
      credentials:
        default:
          username: admin
          password: cisco123

    R2:
      os: iosxe
      type: router
      connections:
        cli:
          protocol: ssh
          ip: 192.168.101.12
      credentials:
        default:
          username: admin
          password: cisco123

    R3:
      os: iosxe
      type: router
      connections:
        cli:
          protocol: ssh
          ip: 192.168.101.13
      credentials:
        default:
          username: admin
          password: cisco123
Post-validation CLI Screenshots (Expected Output)
R1:
R1# show processes cpu
CPU utilization for five seconds: 7%/0%; one minute: 8%; five minutes: 9%

R1# show processes memory
Total: 50000000 bytes
Used: 20000000 bytes
Free: 30000000 bytes
Script Output:
{
  "R1": {"cpu_utilization": 7, "memory_utilization": 40.0},
  "R2": {"cpu_utilization": 5, "memory_utilization": 35.5},
  "R3": {"cpu_utilization": 6, "memory_utilization": 38.2}
}
FAQs
1. Can the script set thresholds and trigger alerts?
Yes. You can define CPU and memory usage thresholds and extend the script to send alerts via email, Slack, or webhook integrations when limits are exceeded.
2. Does the monitoring work for both IOS and IOS-XR devices?
Yes. With Genie parsers, the script supports IOS, IOS-XE, and IOS-XR platforms for accurate CPU and memory statistics.
3. How often can this script be executed without overloading the devices?
Since it uses lightweight read-only show commands, it can be safely scheduled at frequent intervals (e.g., every 5-10 minutes) without causing additional load.
4. Can it monitor long-term trends for performance analysis?
Yes. By storing JSON outputs over time, you can analyze CPU and memory usage trends to predict future capacity issues or detect anomalies.
5. Is the solution scalable for hundreds of network devices?
Absolutely. pyATS supports concurrent sessions, making it efficient to monitor large-scale networks.
6. Can I visualize the results in a dashboard?
Yes. You can feed the output into tools like Grafana, Kibana, or even generate Python-based charts for real-time visualization.
7. Does it detect memory leaks or process anomalies automatically?
While it doesn’t directly detect memory leaks, analyzing historical data can help identify abnormal memory usage patterns indicative of leaks.
8. Is it safe to run this in a production environment?
Yes. The script only executes non-intrusive show commands and does not alter the running configuration, making it safe for production use.
YouTube Link
Watch the Complete Python for Network Engineer: CPU & Memory Utilization Monitoring Using pyATS for Cisco [Python for Network Engineer] Lab Demo & Explanation on our channel:
Join Our Training
Automating CPU and memory monitoring helps you proactively manage device health and prevent outages. Trainer Sagar Dhawan offers a 3-month instructor-led program covering Python, Ansible, APIs, and Cisco DevNet for Network Engineers, teaching you how to automate real-world operational tasks like these.
Join Our Training to become proficient in Python for Network Engineer automation skills.
Enroll Now & Future‑Proof Your Career
Email: info@networkjourney.com
WhatsApp / Call: +91 97395 21088
![[DAY#10 PyATS Series] Parsing and Normalizing ARP Tables (Multi-Vendor) using pyATS (Vendor-Agnostic) [Python for Network Engineer]](https://networkjourney.com/wp-content/uploads/2025/07/Parsing-and-Normalizing-ARP-Tables-Multi-Vendor-using-pyATS-Vendor-Agnostic-1.png)
![[Day #19 Pyats Series] Introduction to Trigger APIs in pyATS using pyATS for Cisco](https://networkjourney.com/wp-content/uploads/2025/07/Introduction-to-Trigger-APIs-in-pyATS-using-pyATS-for-Cisco.png)