![[Day #42 PyATS Series] IP SLA Monitoring Automation (Cisco-Specific) Using pyATS for Cisco [Python for Network Engineer]](https://networkjourney.com/wp-content/uploads/2025/08/Day-42-PyATS-Series-IP-SLA-Monitoring-Automation-Cisco-Specific-Using-pyATS-for-Cisco-Python-for-Network-Engineer.png)
Trainer Sagar Dhawan
- Posted on
[Day #42 PyATS Series] IP SLA Monitoring Automation (Cisco-Specific) Using pyATS for Cisco [Python for Network Engineer]
Table of Contents
Introduction on the Key Points
In modern enterprise networks, ensuring end-to-end service availability and performance is critical. Cisco’s IP SLA (Service Level Agreement) feature allows network engineers to measure parameters such as latency, jitter, packet loss, and response times between devices. Traditionally, IP SLA statistics are manually checked via CLI or SNMP, which is both time-consuming and error-prone.
With pyATS, we can automate IP SLA monitoring by programmatically collecting SLA statistics, validating thresholds, and generating real-time health reports. This approach:
- Reduces manual effort
- Detects latency or packet loss issues early
- Integrates with dashboards for continuous monitoring
- Standardizes SLA validation across multiple Cisco devices
This post is perfect for those pursuing Python for Network Engineer skills and looking to scale their network monitoring capabilities.
Topology Overview
Our lab topology includes:
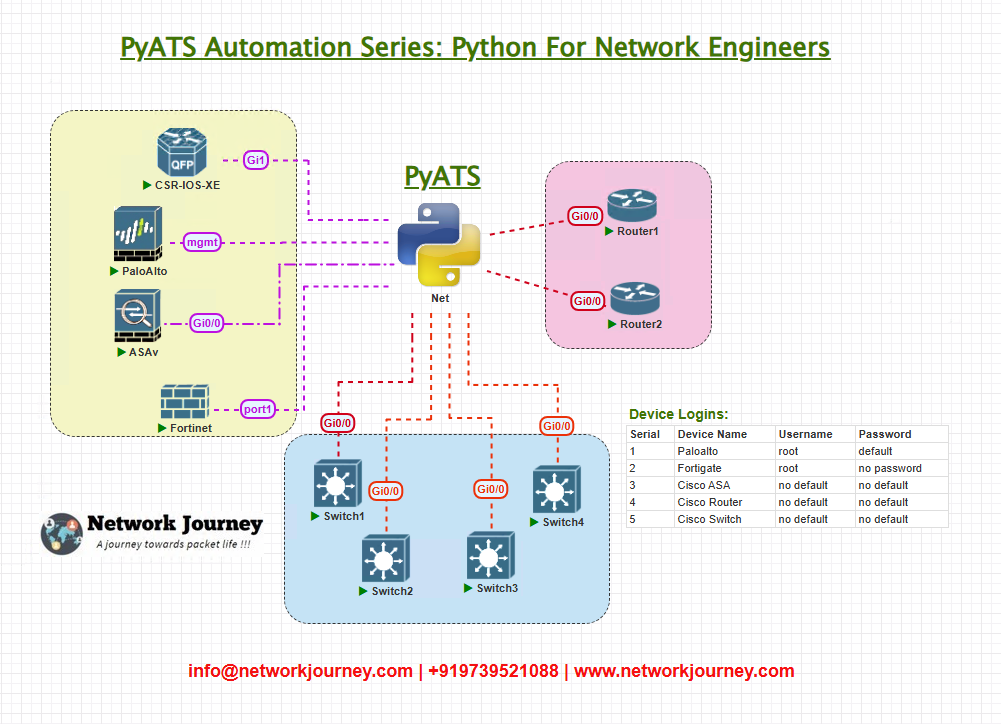
- IP SLA probes are configured on branch and core routers to measure network health.
- Probes include ICMP echo (ping), UDP jitter, and TCP connect tests.
- The goal is to automate SLA status collection and verify results meet defined thresholds.
Topology & Communications
- Cisco Routers: Running IP SLA operations with different probes.
- Monitoring: pyATS connects to each router via SSH.
- Data Collection: Extracts IP SLA operational data from CLI commands (
show ip sla statisticsandshow ip sla configuration). - Validation: Ensures latency, jitter, and packet loss remain within SLA-defined limits.
- Vendor-specific: This article focuses on Cisco devices but can be extended for others using APIs or CLI parsing.
Workflow Script
from genie.testbed import load
import json

# SLA Thresholds
THRESHOLDS = {
    "latency_ms": 50,
    "packet_loss_percent": 1
}

def collect_ip_sla_stats(device):
    device.connect(log_stdout=False)
    output = device.parse("show ip sla statistics")
    device.disconnect()

    stats = []
    operations = output.get("entries", {})

    for op_id, op_data in operations.items():
        latency = op_data.get("latest_rtt", 0)
        loss = op_data.get("packet_loss", {}).get("percent", 0)
        status = "PASS"

        if latency > THRESHOLDS["latency_ms"] or loss > THRESHOLDS["packet_loss_percent"]:
            status = "FAIL"

        stats.append({
            "operation_id": op_id,
            "latency_ms": latency,
            "packet_loss_percent": loss,
            "status": status
        })

    return stats

if __name__ == "__main__":
    testbed = load("testbed.yml")
    results = {}

    for name, device in testbed.devices.items():
        print(f"Collecting IP SLA stats from {name}...")
        results[name] = collect_ip_sla_stats(device)

    with open("ip_sla_report.json", "w") as f:
        json.dump(results, f, indent=4)

    print("IP SLA monitoring completed. Report saved to ip_sla_report.json")
Explanation by Line
- THRESHOLDS: Defines acceptable latency and packet loss limits.
- collect_ip_sla_stats: Connects to the router, parses SLA statistics, and evaluates health status.
- Genie Parser: Extracts structured data from
show ip sla statistics. - Validation Logic: Marks each SLA operation as PASS or FAIL based on thresholds.
- Results: A JSON file summarizes SLA health across all routers.
testbed.yml Example
testbed:
  name: ip_sla_monitoring
  devices:
    Branch_Router:
      os: iosxe
      type: router
      connections:
        cli:
          protocol: ssh
          ip: 192.168.10.1
      credentials:
        default:
          username: admin
          password: branch123

    Core_Router:
      os: iosxe
      type: router
      connections:
        cli:
          protocol: ssh
          ip: 192.168.10.2
      credentials:
        default:
          username: admin
          password: core123

    DC_Router:
      os: iosxe
      type: router
      connections:
        cli:
          protocol: ssh
          ip: 192.168.10.3
      credentials:
        default:
          username: admin
          password: dc123
Post-validation CLI Screenshots (Expected Output)
Sample Cisco CLI Output:
Router# show ip sla statistics
Entry number: 1
Type of operation: icmp-echo
Latest RTT: 20 ms
Packet Loss: 0%

Entry number: 2
Type of operation: udp-jitter
Latest RTT: 35 ms
Packet Loss: 1%
Script JSON Output:
{
    "Branch_Router": [
        {
            "operation_id": "1",
            "latency_ms": 20,
            "packet_loss_percent": 0,
            "status": "PASS"
        },
        {
            "operation_id": "2",
            "latency_ms": 35,
            "packet_loss_percent": 1,
            "status": "PASS"
        }
    ],
    "Core_Router": [
        {
            "operation_id": "1",
            "latency_ms": 60,
            "packet_loss_percent": 2,
            "status": "FAIL"
        }
    ]
}
FAQs
1. What is IP SLA in Cisco devices, and why is it important for automation?
IP SLA is a Cisco feature that measures network performance metrics like latency, jitter, and packet loss. Automating IP SLA with pyATS allows network engineers to continuously validate service quality without manual CLI checks.
2. How does pyATS collect IP SLA data from routers?
pyATS uses Genie parsers to execute commands such as show ip sla statistics and show ip sla configuration. It converts the CLI output into structured Python dictionaries, making it easy to validate thresholds and monitor performance automatically.
3. Can this automation handle multiple SLA operations across devices?
Yes. The script can connect to multiple Cisco routers and collect SLA results for multiple operation IDs (ICMP, UDP, TCP). This enables comprehensive SLA monitoring for large networks.
4. Is it possible to trigger alerts if SLA thresholds are breached?
Absolutely. The automation can be enhanced to send email, Slack, or webhook alerts if latency or packet loss exceeds defined limits. This enables proactive network issue detection.
5. Does this script work with other vendors like Arista or Palo Alto?
This specific solution is Cisco-focused since IP SLA is a Cisco feature. However, you can achieve similar SLA monitoring for other vendors using SNMP, REST APIs, or custom CLI parsing with pyATS.
6. How frequently should automated IP SLA checks be scheduled?
It’s recommended to run SLA checks every 5–10 minutes or in line with your monitoring policies. pyATS scripts can be scheduled via cron jobs, Jenkins, or CI/CD pipelines.
7. Does this automation modify router configurations?
No. The example script only reads SLA statistics without changing device configuration. pyATS can be extended to configure IP SLA operations if needed, but monitoring scripts are non-intrusive.
8. Can IP SLA results be integrated into dashboards or reports?
Yes. The JSON output from pyATS can be fed into Grafana, Kibana, or custom Flask dashboards, providing real-time SLA visualization and historical performance trends.
YouTube Link
Watch the Complete Python for Network Engineer: IP SLA Monitoring Automation (Cisco-Specific) Using pyATS for Cisco [Python for Network Engineer] Lab Demo & Explanation on our channel:
Join Our Training
Manually checking IP SLA stats across multiple routers is inefficient and error-prone. With pyATS, you can automate SLA monitoring, validate thresholds, and ensure consistent service availability.
Trainer Sagar Dhawan is offering a 3-month instructor-led course that covers Python, Ansible, APIs, and Cisco DevNet tailored for network engineers. You’ll learn how to:
- Automate IP SLA and other performance monitoring tasks
- Build scalable multi-vendor network validation scripts
- Integrate monitoring with CI/CD pipelines
Join Our Training to future-proof your career in Python for Network Engineer automation.
Enroll Now & Future‑Proof Your Career
Email: info@networkjourney.com
WhatsApp / Call: +91 97395 21088
![[Day #23 PyATS Series] Interface Error Counters Monitoring Using pyATS for Cisco](https://networkjourney.com/wp-content/uploads/2025/07/Interface-error-counters-monitoring.png)
![[Day#3 PyATS Series] Installing pyATS & Genie (core, NX-OS, IOS-XR plugins) using pyATS for Cisco](https://networkjourney.com/wp-content/uploads/2025/07/Day3-PyATS-Series-Installing-pyATS-Genie-core-NX-OS-IOS-XR-plugins-using-pyATS-for-Cisco_networkjouney.png)
![[Day #81 Pyats Series] Building pyATS test suites for 1000+ devices using pyATS for Cisco [Python for Network Engineer]](https://networkjourney.com/wp-content/uploads/2025/08/Building-pyATS-test-suites-for-1000-devices-using-pyATS-for-Cisco.png)