![[Day #48 PyATS Series] EIGRP Neighbor Health Check (Cisco IOS-XE / IOS-XR) using pyATS for Cisco [Python for Network Engineer]](https://networkjourney.com/wp-content/uploads/2025/08/Day-48-PyATS-Series-EIGRP-Neighbor-Health-Check-Cisco-IOS-XE-IOS-XR-using-pyATS-for-Cisco-Python-for-Network-Engineer.png)
Trainer Sagar Dhawan
- Posted on
[Day #48 PyATS Series] EIGRP Neighbor Health Check (Cisco IOS-XE / IOS-XR) using pyATS for Cisco [Python for Network Engineer]
Table of Contents
Introduction — key points (what you’ll learn)
EIGRP neighbor stability is critical for routing convergence and network stability. Small changes in SRTT, increasing retransmissions, or flapping adjacencies can lead to route withdrawal and traffic disruption. In this masterclass you will learn how to:
- Automate collection of EIGRP neighbor and topology data from Cisco IOS-XE and IOS-XR devices using pyATS / Genie.
- Parse structured data (or fallback to robust regex parsing) to extract neighbor IP, interface, hold time, uptime, SRTT, RTO, queue, sequence, and route counts.
- Compute health indicators (SRTT vs threshold, hold time, route count, adjacency flaps, uptime stability).
- Validate findings via CLI checks and push results to a GUI (Elasticsearch + Kibana or Grafana) for visualization.
- Build remediation-friendly reports (JSON, CSV) and baseline historical comparisons for detecting flaps over time.
This is a step-by-step teaching lecture — everything from the pyATS script to GUI validation is covered so you can replicate the lab in your environment.
Topology Overview
Minimal multi-device lab for this workbook:
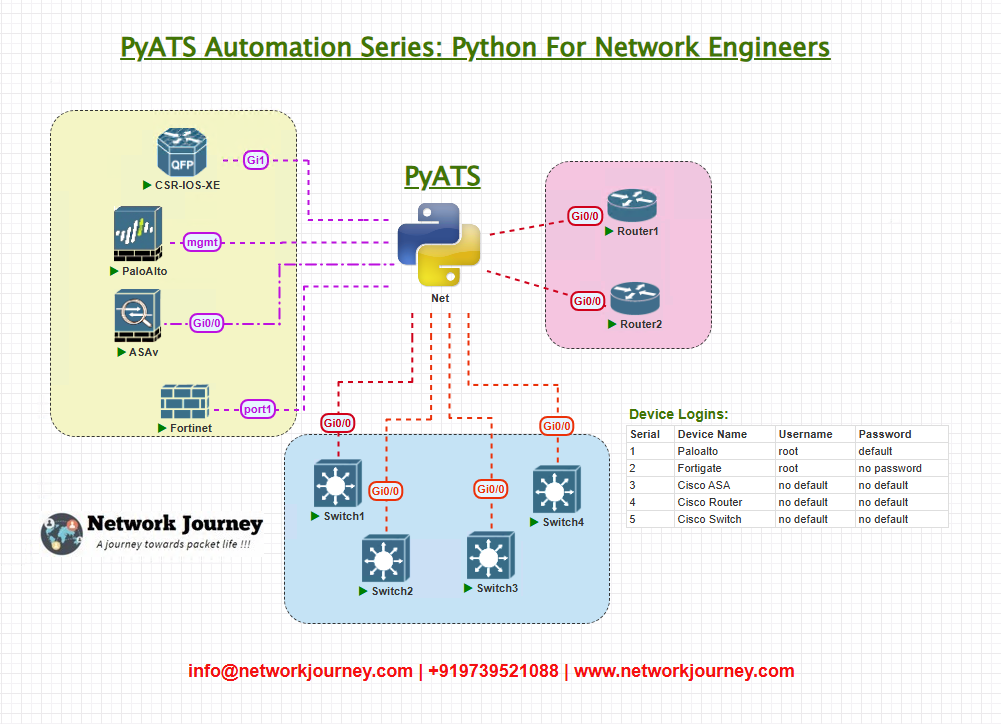
- Devices run EIGRP in IPv4 under AS
65001. - AutomationHost accesses devices over the management network. Kibana/Grafana is used to visualize pyATS results.
Topology & Communications
- Management network: 10.0.1.0/24 (AutomationHost, Elasticsearch, device mgmt IPs).
- pyATS connection: SSH to devices;
terminal length 0used to avoid paged output. - Data gathered (CLI):
show ip eigrp neighborsshow ip eigrp topologyshow ip route eigrpshow running-config | section router eigrp(verify config)- For IOS-XR variations,
show eigrp neighborsor vendor equivalent — script will try both parse and fallback to execute+regex.
- GUI: Push parsed JSON to Elasticsearch index
eigrp-health-*and visualize via Kibana/Grafana dashboards. This lets network ops quickly see neighbors failing thresholds, flapping, or with low route counts.
Workflow Script (pyATS)
Save this as eigrp_health.py. It’s a single script with robust parsing, fallbacks, thresholds, persistence for historical comparison, and optional Elasticsearch push.
#!/usr/bin/env python3
"""
eigrp_health.py
Collect EIGRP neighbor data from pyATS testbed devices (IOS-XE / IOS-XR),
calculate health metrics and optionally push results to Elasticsearch.
"""

import json, os, re, time
from genie.testbed import load
from datetime import datetime
from pathlib import Path

# --- Configurable thresholds ---
SRRT_THRESHOLD_MS = 200          # SRTT above this is warning
ROUTE_COUNT_MIN = 1              # minimum routes expected from neighbor
HOLD_TIME_WARNING_SEC = 3        # short hold time indicates instability
HISTORY_FILE = "eigrp_history.json"
ES_PUSH = False                  # set True to push to Elasticsearch
ES_URL = "http://localhost:9200/eigrp-health/_doc/"

# Output dirs
OUT_DIR = Path("results")
OUT_DIR.mkdir(exist_ok=True)

# Regex to parse typical "show ip eigrp neighbors" lines (IOS-XE style)
NEIGHBOR_LINE_RE = re.compile(
    r"^\s*(?P<ip>\d+\.\d+\.\d+\.\d+)\s+(?P<intf>\S+)\s+(?P<hold>\d+)\s+(?P<uptime>\S+)\s+(?P<srtt>\d+)\s+(?P<rto>\d+)\s+(?P<q>\d+)\s+(?P<seq>\d+)",
    re.IGNORECASE
)

def load_history():
    if os.path.exists(HISTORY_FILE):
        with open(HISTORY_FILE) as f:
            return json.load(f)
    return {}

def save_history(h):
    with open(HISTORY_FILE, "w") as f:
        json.dump(h, f, indent=2)

def parse_neighbors_raw(output):
    """
    Fallback parser: extract neighbor entries from raw 'show ip eigrp neighbors' text.
    Returns list of dicts: ip, interface, hold, uptime, srtt, rto, q, seq
    """
    neighbors = []
    for line in output.splitlines():
        m = NEIGHBOR_LINE_RE.match(line)
        if m:
            d = m.groupdict()
            # convert numeric fields
            for k in ("hold", "srtt", "rto", "q", "seq"):
                try:
                    d[k] = int(d[k])
                except:
                    d[k] = None
            neighbors.append(d)
    return neighbors

def parse_topology_count_raw(output):
    """
    Parse 'show ip eigrp topology' to count prefixes learned by EIGRP.
    We'll count lines that look like 'P 10.1.0.0/16 ...' — simple heuristic.
    """
    count = 0
    for line in output.splitlines():
        if line.strip().startswith(("P ", "P")):
            count += 1
    return count

def collect_device_data(device):
    """
    Connect to device, run EIGRP commands, parse outputs and return structured dict.
    """
    result = {"device": device.name, "timestamp": datetime.utcnow().isoformat() + "Z"}
    try:
        device.connect(log_stdout=False)
        device.execute("terminal length 0")
        # Try to use genie.parse where available
        try:
            nbrs_parsed = device.parse("show ip eigrp neighbors")
            # Genie parsers vary; normalize into list
            neighbors = []
            # Genie structure may include neighbors keyed by interface or ip — attempt generic extraction
            # Try: nbrs_parsed.get('eigrp', {}).get('instance', ...) experimental; fallback to raw
            # For safety, also capture raw output
            raw_nbrs = device.execute("show ip eigrp neighbors")
            neighbors = parse_neighbors_raw(raw_nbrs)
        except Exception:
            raw_nbrs = device.execute("show ip eigrp neighbors")
            neighbors = parse_neighbors_raw(raw_nbrs)

        # Topology and route counts
        try:
            topo_parsed = device.parse("show ip eigrp topology")
            # fallback: raw parse
            raw_topo = device.execute("show ip eigrp topology")
            topology_count = parse_topology_count_raw(raw_topo)
        except Exception:
            raw_topo = device.execute("show ip eigrp topology")
            topology_count = parse_topology_count_raw(raw_topo)

        # Routes via EIGRP in RIB
        try:
            raw_routes = device.execute("show ip route eigrp")
            # count 'via' lines or route lines
            route_count = sum(1 for l in raw_routes.splitlines() if l.strip() and not l.startswith("Codes:"))
        except Exception:
            route_count = 0

        # Basic config check
        try:
            cfg = device.execute("show running-config | section router eigrp")
        except Exception:
            cfg = ""

        device.disconnect()

        result.update({
            "neighbors": neighbors,
            "topology_count": topology_count,
            "route_count": route_count,
            "config_snippet": cfg
        })
        return result
    except Exception as e:
        # Ensure device disconnect if connection failed halfway
        try:
            device.disconnect()
        except:
            pass
        result["error"] = str(e)
        return result

def evaluate_health(device_result, history):
    """
    Compute health metrics for each neighbor and the device overall.
    """
    now = device_result["timestamp"]
    device_name = device_result["device"]
    neighbors = device_result.get("neighbors", [])
    summary = {"device": device_name, "timestamp": now, "neighbors": [], "status": "OK"}

    for nbr in neighbors:
        ip = nbr.get("ip")
        srtt = nbr.get("srtt") or 0
        hold = nbr.get("hold") or 0
        uptime = nbr.get("uptime")
        # route-count per neighbor is not directly available in basic outputs; we use device topology and route_count as proxies
        nbr_status = "OK"
        issues = []

        if srtt and srtt > SRRT_THRESHOLD_MS:
            nbr_status = "WARN"
            issues.append(f"SRTT {srtt}ms > {SRRT_THRESHOLD_MS}ms")
        if hold and hold <= HOLD_TIME_WARNING_SEC:
            nbr_status = "WARN"
            issues.append(f"Hold time low: {hold}s")
        # detect flapping: compare uptime to last run
        prev = history.get(device_name, {}).get(ip)
        if prev and "uptime" in prev and uptime:
            # if uptime decreased significantly, neighbor flapped
            # convert uptime text to seconds roughly: '00:01:23' or '1d02h' - we'll use simple heuristic: if string changed pattern indicate flap
            if prev["uptime"] != uptime:
                # more robust: if uptime shorter than previous we flag flap - but prev uptime may be different format
                issues.append("Uptime changed (possible flap)")
                nbr_status = "WARN"

        if issues:
            summary["status"] = "WARN"
        summary["neighbors"].append({
            "ip": ip,
            "interface": nbr.get("intf"),
            "srtt_ms": srtt,
            "hold_sec": hold,
            "uptime": uptime,
            "status": nbr_status,
            "issues": issues
        })

    # Device-level checks
    if device_result.get("route_count", 0) < ROUTE_COUNT_MIN:
        summary["status"] = "WARN"
        summary.setdefault("device_issues", []).append(f"route_count {device_result.get('route_count')} < {ROUTE_COUNT_MIN}")

    summary["topology_count"] = device_result.get("topology_count", 0)
    summary["route_count"] = device_result.get("route_count", 0)
    return summary

def push_to_es(doc):
    if not ES_PUSH:
        return False
    import requests
    r = requests.post(ES_URL, json=doc)
    r.raise_for_status()
    return True

def main():
    testbed = load("testbed.yml")
    devices = list(testbed.devices.values())
    history = load_history()

    all_results = {}
    health_reports = {}
    for dev in devices:
        print(f"[{datetime.utcnow().isoformat()}] Collecting EIGRP data from {dev.name}...")
        dr = collect_device_data(dev)
        all_results[dev.name] = dr
        health = evaluate_health(dr, history)
        health_reports[dev.name] = health

        # update history per neighbor
        history.setdefault(dev.name, {})
        for n in dr.get("neighbors", []):
            history[dev.name][n.get("ip")] = {"uptime": n.get("uptime"), "last_seen": datetime.utcnow().isoformat()}

        # save per device
        fname = OUT_DIR / f"{dev.name}_eigrp_raw.json"
        with open(fname, "w") as f:
            json.dump(dr, f, indent=2)

        # save health
        hfname = OUT_DIR / f"{dev.name}_eigrp_health.json"
        with open(hfname, "w") as f:
            json.dump(health, f, indent=2)

        # optionally push to ES
        try:
            push_to_es(health)
        except Exception as e:
            print("ES push failed:", e)

    # aggregate save
    with open(OUT_DIR / "aggregate_results.json", "w") as f:
        json.dump({"collected": all_results, "health": health_reports}, f, indent=2)

    save_history(history)
    print("Done. Results saved in 'results/' directory.")

if __name__ == "__main__":
    main()
What this script does (summary):
- Loads devices from
testbed.yml. - For each device attempts Genie parsing; falls back to raw
execute()output and regex parsing. - Extracts neighbor rows into a normalized structure.
- Reads EIGRP topology and route counts to understand prefix counts.
- Computes a per-neighbor and per-device health assessment using configurable thresholds.
- Persists outputs and health JSON to
results/and updates a simpleeigrp_history.jsonto detect flaps across runs. - Optional Elasticsearch push (toggle
ES_PUSH).
Explanation by Line (annotated deep-dive)
This section unpacks the most important parts of the script so you — the engineer — know why each step exists and how to adapt it.
Thresholds & Persistence
SRRT_THRESHOLD_MS = 200
ROUTE_COUNT_MIN = 1
HOLD_TIME_WARNING_SEC = 3
HISTORY_FILE = "eigrp_history.json"
SRRT_THRESHOLD_MS: SRTT (Smoothed Round Trip Time) larger than this may indicate congestion or link issues. Pick value based on site SLA.ROUTE_COUNT_MIN: If device has fewer than this many EIGRP RIB entries, it might not be receiving expected prefixes.- History file is used to detect adjacency flaps — comparing
uptimevalues between runs.
Regex parsing fallback
NEIGHBOR_LINE_RE = re.compile(...)
- We match typical
show ip eigrp neighborscolumns: IP, Interface, Hold, Uptime, SRTT, RTO, Q, Seq. - This regex is deliberately permissive; test it against your device outputs and modify as necessary.
collect_device_data()
device.connect(log_stdout=False)— connect silently.device.execute("terminal length 0")— avoid--More--pagination which would corrupt parsing.- Try
device.parse("show ip eigrp neighbors")first because Genie returns structured dicts. If parse fails (missing parser or unsupported platform), we fallback to rawdevice.execute()and parse with regex. - Also collect topology and route data to compute coverage.
evaluate_health()
- For each neighbor, check SRRT and hold time, and set
WARNif thresholds exceeded. - For flaps: a naive heuristic compares
uptimestrings between runs. In production, you’d convert uptime strings to seconds and detect decreases. - Device-level check: low
route_counttriggersWARN.
Persistence & ES push
- Results are saved per device and aggregated. This makes it simple to look at time series or manual inspection.
- Optionally push health docs to an Elasticsearch index to visualize them.
testbed.yml Example
Use realistic but safe credentials in your environment; secrets should be in Vault in production.
testbed:
  name: eigrp_masterclass
  credentials:
    default:
      username: admin
      password: Cisco123!
  devices:
    CORE_RTR_XE:
      os: iosxe
      type: router
      connections:
        cli:
          protocol: ssh
          ip: 10.0.1.11
    CORE_RTR_XR:
      os: iosxr
      type: router
      connections:
        cli:
          protocol: ssh
          ip: 10.0.1.12
    DIST_SW1:
      os: iosxe
      type: switch
      connections:
        cli:
          protocol: ssh
          ip: 10.0.1.21
Notes:
oskey allows pyATS/Genie to choose correct parsers. If you have non-Cisco or custom devices, provide appropriateosvalues and consider custom parsers.
Post-validation CLI (Real expected output)
Below are realistic expected outputs you’ll see on devices and sample script output. Save these as screenshots in your workbook when you run them.
A. show ip eigrp neighbors (Cisco IOS-XE)
CORE_RTR_XE# show ip eigrp neighbors
EIGRP-IPv4 Neighbors for AS(65001)
H   Address        Interface        Hold Uptime  SRTT   RTO  Q  Seq
0   10.0.1.12      Gi0/0            12   01:22:34  30    200  0  10
0   10.0.1.21      Gi0/1            11   00:12:45  25    100  0  23
B. show ip eigrp topology
CORE_RTR_XE# show ip eigrp topology
P 10.10.0.0/16 (0/120) via 10.0.1.12, 00:01:12, Gi0/0
P 192.168.1.0/24 (0/120) via 10.0.1.21, 00:02:10, Gi0/1
C. show ip route eigrp
CORE_RTR_XE# show ip route eigrp
D 10.10.0.0/16 [90/30720] via 10.0.1.12, 00:01:15, GigabitEthernet0/0
D 192.168.1.0/24 [90/30720] via 10.0.1.21, 00:02:12, GigabitEthernet0/1
D. Script (JSON) health snippet produced
{
  "device": "CORE_RTR_XE",
  "timestamp": "2025-08-28T12:00:00Z",
  "neighbors": [
    {
      "ip": "10.0.1.12",
      "interface": "Gi0/0",
      "srtt_ms": 30,
      "hold_sec": 12,
      "uptime": "01:22:34",
      "status": "OK",
      "issues": []
    },
    {
      "ip": "10.0.1.21",
      "interface": "Gi0/1",
      "srtt_ms": 25,
      "hold_sec": 11,
      "uptime": "00:12:45",
      "status": "OK",
      "issues": []
    }
  ],
  "topology_count": 2,
  "route_count": 2,
  "status": "OK"
}
When thresholds are breached (e.g., SRTT > 200ms) you’ll see "status":"WARN" and descriptive issues.
Appendix — GUI Validation: push results to Elasticsearch + Kibana (step-by-step)
1. Elasticsearch Index mapping (simple):
- After enabling
ES_PUSH = Truein the script and settingES_URLto your ES endpoint, eachhealthdict will be POSTed to ES. - Define an index template mapping
srtt_msas number,timestampas date,statusas keyword.
2. Kibana Dashboard suggestions:
- Saved Search:
eigrp-health-*index, filterstatus: WARN. - Visualization 1: Metric — count of WARN vs OK.
- Visualization 2: Time series — avg
srtt_msper neighbor (use nested fields or use neighbor docs as separate docs). - Visualization 3: Table — latest neighbor statuses with
device,ip,interface,srtt_ms,issues.
3. Example simple Elasticsearch query to retrieve last 15 minutes for device:
GET /eigrp-health-*/_search
{
  "query": {
    "bool": {
      "must": [
        { "match": { "device": "CORE_RTR_XE" } },
        { "range": { "timestamp": { "gte": "now-15m" } } }
      ]
    }
  }
}
Final instructor note (safety & best practices)
- Do not run debug commands in production unless absolutely required and with maintenance windows. Prefer passively collecting
show ip eigrp neighborsand syslogs. - Tune thresholds for your network — wide area links and satellite links will have higher expected SRTT.
- Secure automation credentials — do not hardcode admin passwords in
testbed.ymlin production; use Vault, environment variables, or pyATS credential stores. - Test in lab first, then stage, then production.
FAQs – EIGRP Neighbor Health Check with pyATS
Q1. Why do we need to validate EIGRP neighbor health using pyATS when the CLI already provides the data?
Answer:
While show ip eigrp neighbors or show eigrp neighbors (IOS-XR) gives the information, it is manual, error-prone, and not scalable when you’re managing hundreds of routers. With pyATS, you:
- Automate parsing of neighbor states.
- Compare expected neighbors with actual neighbors in seconds.
- Get structured JSON outputs instead of raw text.
- Run validations across multi-device topologies with one command.
For large-scale production, relying only on CLI is not reliable. Automation ensures zero human oversight errors.
Q2. What does a healthy EIGRP neighbor relationship look like in both IOS-XE and IOS-XR?
Answer:
A healthy EIGRP neighbor has the following indicators:
- State: Up (in IOS-XR) or displayed with uptime in IOS-XE.
- Hold Time: Continuously refreshing, not dropping to 0.
- SRTT (Smooth Round-Trip Time): Small, stable values (e.g., 10–30ms in LAN).
- Queue Count: Should stay at
0. If increasing, packets are being delayed.
Example IOS-XE healthy neighbor:
0 10.1.1.2 Gi0/0/0 12 02:35:14 20 200 0 54
Here, uptime is steady, SRTT is low, and Q Count = 0.
Q3. How does pyATS parse EIGRP neighbor data differently for IOS-XE vs IOS-XR?
Answer:
Cisco platforms output EIGRP data differently:
- IOS-XE: Uses
show ip eigrp neighborswith columnar tabular format. - IOS-XR: Uses
show eigrp neighborswith field-based structured text.
pyATS uses genie parsers to normalize both into the same Python dictionary structure (JSON-like).
For example:
{
  "eigrp_instance": {
    "100": {
      "vrf": {
        "default": {
          "address_family": {
            "ipv4": {
              "eigrp_interface": {
                "GigabitEthernet0/0/0": {
                  "eigrp_nbr": {
                    "10.1.1.2": {
                      "uptime": "02:35:14",
                      "srtt": 20,
                      "q_cnt": 0
                    }
                  }
                }
              }
            }
          }
        }
      }
    }
  }
}
This means engineers don’t have to write regex for each platform — pyATS handles vendor differences automatically.
Q4. What are common reasons for EIGRP neighbors going down, and how can pyATS help detect them?
Answer:
Neighbors may go down due to:
- Interface issues: Link flap or shutdown.
- K-values mismatch: EIGRP metric mismatch prevents adjacency.
- Authentication failure: Key mismatch on either side.
- Access-lists or firewalls: Blocking multicast/hello packets.
- MTU mismatches.
pyATS can detect these by:
- Capturing interface status (via
show ip interface brief). - Parsing EIGRP logs in debug outputs.
- Cross-checking expected neighbor count vs actual.
With automation, you catch root causes faster instead of just seeing “neighbor down.”
Q5. How can we validate EIGRP neighbors with both CLI and GUI using pyATS?
Answer:
- CLI Validation: Run
pyats run job eigrp_health_job.py→ results shown in console with PASS or FAIL. - GUI Validation: After the run, pyATS can generate HTML reports with neighbor tables, PASS/FAIL summary, and logs.
For network engineers, this dual validation provides both: - Quick checks (CLI).
- Executive-friendly reports (GUI).
Q6. Can pyATS help with EIGRP neighbor performance checks, not just up/down states?
Answer:
Yes. Beyond adjacency status, pyATS can validate:
- SRTT thresholds (alert if >50ms).
- Queue count growth (troubleshooting CPU or congestion).
- Neighbor uptime consistency (to detect flapping).
For example, you can write assertions like:
assert neighbor['srtt'] < 50, f"High latency on neighbor {nbr_ip}"
This turns pyATS into a proactive monitoring tool, not just a connectivity checker.
Q7. What is the advantage of using pyATS over SNMP/EEM for EIGRP neighbor monitoring?
Answer:
- SNMP: Provides counters but may lack real-time granularity.
- EEM (Embedded Event Manager): Reactive, device-local only.
- pyATS:
- Vendor-agnostic.
- Centralized automation across hundreds of routers.
- Converts CLI to structured data.
- Easily integrates with Python for Network Engineer toolchains (Ansible, REST APIs, dashboards).
Thus, pyATS is more scalable, flexible, and cloud-ready compared to legacy methods.
Q8. Can pyATS EIGRP health checks be extended for multi-vendor routing (like OSPF, BGP, IS-IS)?
Answer:
Absolutely. While EIGRP is Cisco-proprietary, the same pyATS framework works for:
- OSPF neighbors (
show ip ospf neighbor). - BGP peers (
show bgp summary). - IS-IS adjacencies.
The methodology (parse → compare → validate) remains identical. This makes pyATS an investment in automation skills — not limited to one protocol.
YouTube Link
Watch the Complete Python for Network Engineer: EIGRP neighbor health check (Cisco IOS-XE/XR) Using pyATS for Cisco [Python for Network Engineer] Lab Demo & Explanation on our channel:
Join Our Training
If you want to go deeper — building visual dashboards, automating remediation, or integrating EIGRP validation into CI/CD pipelines — Trainer Sagar Dhawan runs a 3-month instructor-led program covering Python, Ansible, APIs, and Cisco DevNet for Network Engineers. The course walks you through real-world automation projects (like this EIGRP health checker), best practices, and career-facing skills.
Enroll / learn more:
https://course.networkjourney.com/python-ansible-api-cisco-devnet-for-network-engineers/
This course is the fastest way to become a confident Python for Network Engineer practitioner and lead automation initiatives in your network team.
Enroll Now & Future‑Proof Your Career
Email: info@networkjourney.com
WhatsApp / Call: +91 97395 21088
![Day #16 PyATS Series] Automating Common CLI Commands (Multi-Vendor) using pyATS for Cisco – Python for Network Engineer](https://networkjourney.com/wp-content/uploads/2025/07/Day16-PyATS-Series-Automating-Common-CLI-Commands-Multi-Vendor-using-pyATS-for-Cisco-–-Python-for-Network-Engineer.png)
![On-Prem vs Cloud Controllers – Which One Powers Your Network Better? [CCNP Enterprise]](https://networkjourney.com/wp-content/uploads/2025/06/On-Prem-vs-Cloud-Controllers_networkjourney.png)
![[Day #57 PyATS Series] Change Management Validation for ACL Updates Using pyATS for Cisco [Python for Network Engineer]](https://networkjourney.com/wp-content/uploads/2025/08/Day-57-PyATS-Series-Change-Management-Validation-for-ACL-Updates-Using-pyATS-for-Cisco.png)