
Trainer Sagar Dhawan
- Posted on
[Day 89] Cisco ISE Mastery Training: Integrating with Splunk
Table of Contents
Introduction
Splunk turns your ISE telemetry into searchable, actionable security context. With integration done right, your SOC can pivot from “What just authenticated?” to “Who, from where, with what posture, and what did we do about it?”—in seconds. In this masterclass you’ll build a production-style ingestion pipeline (Syslog → Splunk), add pxGrid-driven response (ANC quarantine from Splunk), and learn Data Connect (ISE 3.2+) for direct reporting queries—plus bullet-proof validation in GUI, CLI, and SPL searches.
We’ll ship dashboards, searches, and test data so you can prove value on day one.
(Uses Splunk Add-on for Cisco ISE with sourcetype cisco:ise:syslog; optional pxGrid/ANC and Data Connect.) (Splunkbase, splunk.github.io)
Problem Statement
- ISE Live Logs are episodic and node-scoped; historical, cross-source correlation is hard.
- Incident handlers need rapid triage (failures, hotspots, rogue MACs, risky VLANs) and closed-loop control (quarantine) from one console.
- Compliance wants retention & reporting beyond MnT, and auditors want who/what/where/when in minutes, not weeks.
- Engineering needs repeatable, normalized fields (CIM) for detections and KPIs across NAC, EDR, and firewalls.
Solution Overview
Three integration tracks (choose one or combine):
- Baseline: Syslog → Splunk + TA for ISE
- ISE sends categorized syslog to Splunk (UDP/TCP/TLS).
- Splunk Add-on for Cisco ISE (TA-cisco_ise) normalizes to
cisco:ise:syslogand maps to CIM so ES/use-case content works immediately. (Splunkbase, splunk.github.io)
- Response: pxGrid → Splunk (ANC from Splunk)
- Splunk acts as a pxGrid client to issue ANC (quarantine) or consume session directory context for investigations. (Cisco Community)
- Reporting at scale: ISE Data Connect (3.2+) → Splunk
- Splunk pulls reporting data directly from ISE via Data Connect for customizable reports/dashboards—no syslog parsing needed for those reports. (Cisco)
(pxGrid Direct and pxGrid Cloud are newer options—see Advanced.) (Cisco)
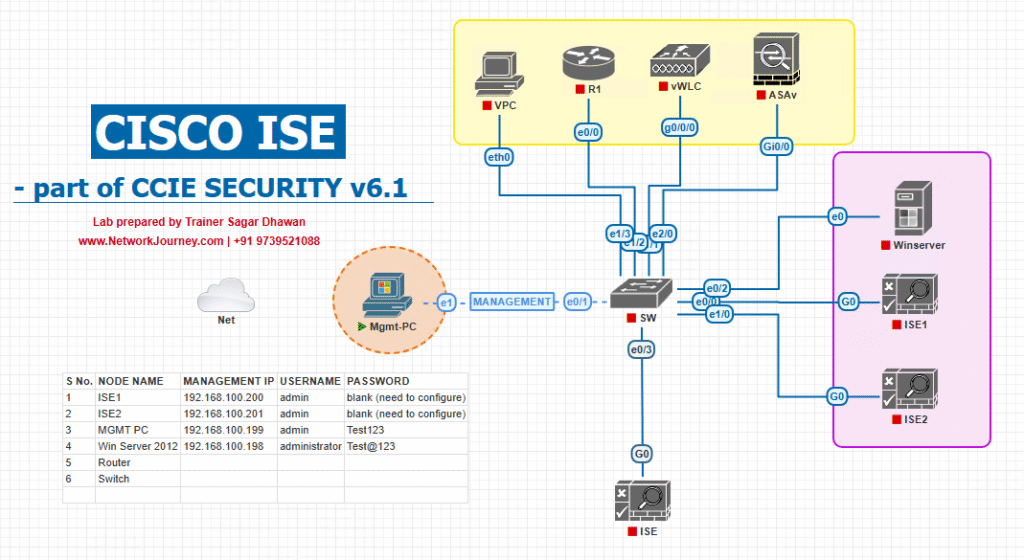
Sample Lab Topology
Platform: VMware (ISE/Splunk), EVE-NG (NADs), plus physical/virtual endpoints.
- ISE: 2 nodes
- ISE-PAN/MnT:
10.10.10.10(Admin/MnT/ERS/pxGrid) - ISE-PSN:
10.10.10.11(RADIUS)
- ISE-PAN/MnT:
- Splunk:
- Heavy Forwarder (HF) / Syslog collector:
10.10.20.20 - Indexer+Search Head (all-in-one lab):
10.10.20.21
- Heavy Forwarder (HF) / Syslog collector:
- Syslog: rsyslog/syslog-ng on HF (TLS 6514 to Splunk or HEC)
- NAD (wired): Cat9K (
10.10.30.30) - WLC: 9800-CL (
10.10.30.40) - Endpoints: Win10, macOS, iOS/Android, IP Phones/Printers/IoT
Topology diagram:
Step-by-Step GUI + CLI Configuration (with validation)
A) Prepare Splunk (HF / Indexer / Search Head)
- Create a dedicated index
- Splunk GUI → Settings → Indexes → New Index:
ise - Retention per policy (e.g., 90–365 days).
- Splunk GUI → Settings → Indexes → New Index:
- Install TA & (optional) App
- Install Splunk Add-on for Cisco ISE on HF & Search Head(s).
- Validates and normalizes ISE logs to
cisco:ise:syslog, supports ISE 2.x–3.4+. (Splunkbase, splunk.github.io)
- Validates and normalizes ISE logs to
- (Optional) Any ISE app/dashboards you prefer.
- Install Splunk Add-on for Cisco ISE on HF & Search Head(s).
- Configure inputs (choose one):
- Option 1: Network Syslog directly in Splunk
- HF GUI → Settings → Data Inputs → UDP 514 (or TCP 514/6514 TLS).
- Set Index =
ise; Sourcetype =cisco:ise:syslog(TA can also auto-assign). (Splunkbase)
- Option 2: rsyslog/syslog-ng → Splunk HEC
- Build JSON at the collector and forward to HEC (
/services/collector) with token. - Advantage: buffering, TLS, back-pressure.
- Build JSON at the collector and forward to HEC (
- Option 1: Network Syslog directly in Splunk
- (Optional) rsyslog TLS 6514 snippet (collector host)
/etc/rsyslog.d/10-ise.conf: module(load="imudp")
# or imtcp module(load="imtcp") input(type="imudp" port="514")
input(type="imtcp" port="6514" StreamDriver="gtls" StreamDriverMode="1" StreamDriverAuthMode="x509/name" PermittedPeer="splunk.example.com") template(name="ISEFmt" type="string" string="<%pri%>%timestamp:::date-rfc3339% %HOSTNAME% %syslogtag%%msg%\n")
if $fromhost-ip == '10.10.10.11' or $fromhost-ip == '10.10.10.10' then { action(type="omfwd" target="10.10.20.21" port="6514" protocol="tcp" StreamDriver="gtls" StreamDriverMode="1" StreamDriverAuthMode="anon" Template="ISEFmt") }

Restart: systemctl restart rsyslog
- Splunk props/transforms sanity (HF)
- Ensure props picks up ISE and timestamps correctly:
$SPLUNK_HOME/bin/splunk btool props list cisco:ise:syslog --debug
- Ensure props picks up ISE and timestamps correctly:
- Validation – Splunk searches
- Search Head:
index=ise sourcetype=cisco:ise:syslog | head 5 - Expect events from ISE with fields (
user,src,mac,nas_ip,action, etc.) if TA is active. (Splunkbase) - If sourcetype wrong, fix input OR deploy TA to the parsing tier (HF/indexer). (Splunk)
- Search Head:
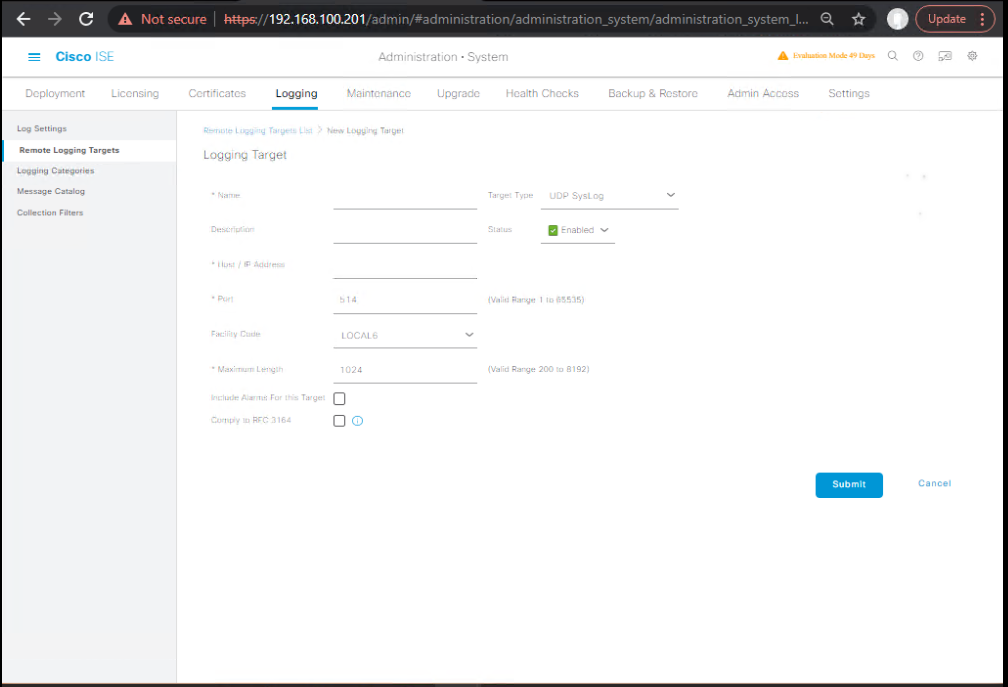
B) Configure External Syslog on ISE
- Add remote syslog target
- ISE GUI → Administration → System → Logging → Remote Logging Targets → Add
- Name:
Splunk-HF - Protocol: TCP (prefer TLS in prod)
- Host:
10.10.20.20(HF) or10.10.20.21(Indexer direct) - Port:
514(UDP/TCP) or6514(TLS) - (If TLS) attach certificate profile.
- [Screenshot: ISE Add Remote Logging Target] (Cisco)
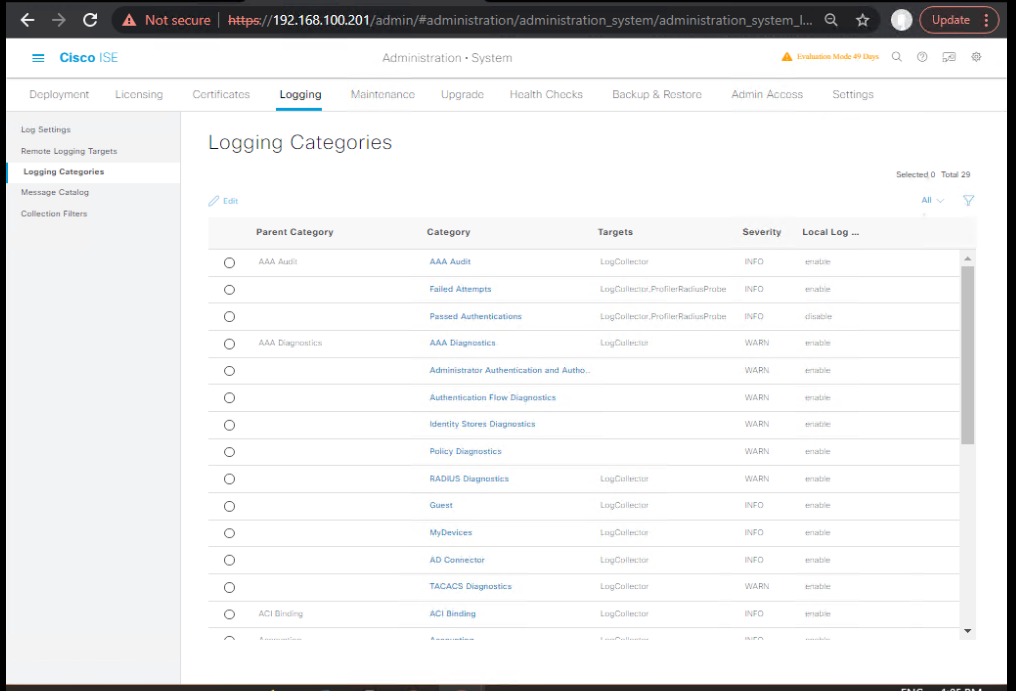
- Bind categories → target
- ISE GUI → Administration → System → Logging → Logging Categories
- Edit: AAA Audit, RADIUS Accounting, Posture, Profiler, Client Provisioning, Admin Audit
- Severity: Informational (or per policy)
- Targets: check Splunk-HF
- [Screenshot: ISE Logging Categories Mapping]
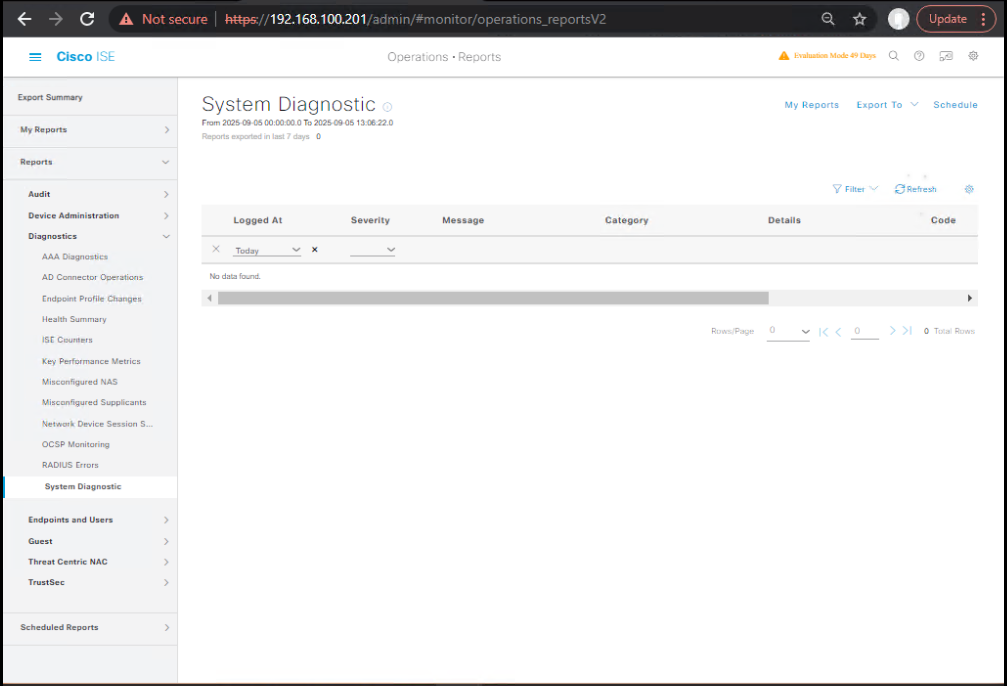
- Validate from ISE side
- ISE GUI → Operations → Reports → Diagnostics → Log Target Status (packets sent / dropped).
- [Screenshot: ISE Log Target Status]
- Generate test traffic
- On Cat9K:
test aaa group radius ise-servers user testuser password 0 Test@123 legacy - Or trigger a MAB/802.1X reauth on an access port:
conf t interface Gi1/0/10 shutdown no shutdown end
- On Cat9K:
- Validate in Splunk
- Immediate test:
index=ise sourcetype=cisco:ise:syslog user=testuser - Troubleshoot ingestion:
- Check HF:
tcpdump -ni any port 514 or port 6514 - Check Splunk metrics:
index=_internal sourcetype=splunkd group=thruput series=idx_ise
- Check HF:
- Immediate test:
C) Optional: pxGrid → Splunk (with ANC from Splunk)
Goal: allow SOC analysts to quarantine directly from Splunk and enrich searches with ISE session data.
- Enable pxGrid services (ISE)
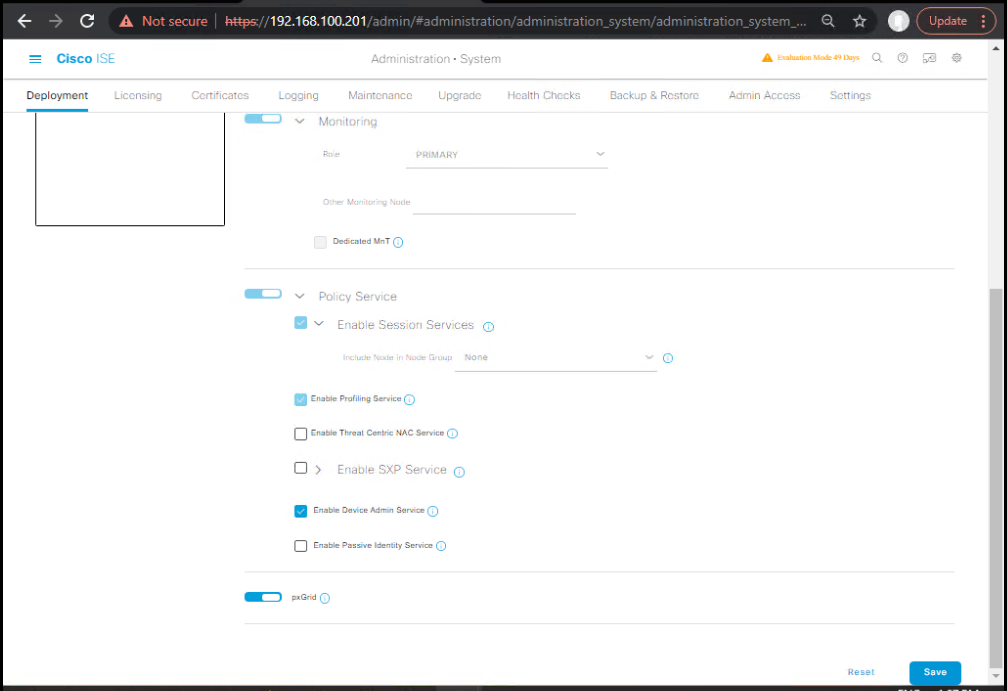
- ISE GUI → Administration → Deployment → select node → pxGrid: Enabled
- Ensure pxGrid certificates (system cert with client auth) trusted by Splunk pxGrid client.
- [Screenshot: ISE Deployment Node pxGrid]
- Splunk pxGrid client/app
- Deploy a pxGrid client on a Linux host or Splunk HF that can:
- Register to pxGrid
- Subscribe to Session Directory topics
- Call ANC (Rapid Threat Containment)
- Cisco’s guide shows ANC from Splunk workflows and cert handling. (Cisco Community)
- Deploy a pxGrid client on a Linux host or Splunk HF that can:
- ANC test from Splunk
- From a Splunk custom action (or REST helper), call ISE ANC (or via pxGrid RTC):
- Action: Quarantine MAC → verify in ISE Operations → Adaptive Network Control.
- [Screenshot: Splunk Alert Action – Quarantine] / [Screenshot: ISE ANC Console] (Cisco Community)
- From a Splunk custom action (or REST helper), call ISE ANC (or via pxGrid RTC):
- Validation
- ISE Live Logs: new session hit with quarantine DACL/VLAN.
- Switch CLI:
show authentication sessions interface Gi1/0/10 details - Splunk:
index=ise "ANC" OR "Quarantine" | timechart count by action
D) Optional: ISE Data Connect → Splunk (3.2+)
Goal: direct, query-driven reporting from ISE to Splunk without parsing syslog.
- Enable & configure Data Connect (ISE 3.2+)
- ISE GUI → Administration → Logging → Data Connect → Enable
- Add Splunk integration (per Cisco doc): set connection, auth, query profile(s). (Cisco)
- [Screenshot: ISE Data Connect Integration Wizard]
- Splunk side
- Use DB/REST modular input (per the guide) to fetch datasets into
index=ise_reports. - Build SPLs on top of structured tables (Auth, Posture, Profiler).
- Use DB/REST modular input (per the guide) to fetch datasets into
- Validation
- Confirm dataset ingest in Splunk:
index=ise_reports | stats count by table - Cross-check vs Live Logs.
- Confirm dataset ingest in Splunk:
E) Field Model + Useful SPL (Starter Pack)
With the TA, common fields are normalized (CIM). (Splunkbase)
Top failures (who/why/where) index=ise sourcetype=cisco:ise:syslog action=failure | stats count by user mac nas_ip failure_reason | sort -count
802.1X vs MAB mix index=ise sourcetype=cisco:ise:syslog | eval method=coalesce(authentication_method, auth_method, "unknown") | timechart span=1h count by method
Quarantined endpoints over time index=ise sourcetype=cisco:ise:syslog ("ANC" OR "Quarantine") | timechart count
High-churn ports (flapping/reauth storms) index=ise sourcetype=cisco:ise:syslog "reauth" | stats count by nas_port_id nas_ip | where count>50
Device profiling drift (IoT hygiene) index=ise sourcetype=cisco:ise:syslog | stats latest(profile) as latest_profile values(profile) as history by mac | where mvcount(history)>1
F) GUI/CLI Validation Checklist (Print & Tick)
- ISE → Remote Target: packets sent increasing; no drops. [Screenshot: Log Target Status] (Cisco)
- Splunk → Index:
index=ise | headshows fresh events within 10s of a test auth. - TA deployed at parsing tier: fields (
user,mac,nas_ip,action) auto-extracted. (Splunkbase) - pxGrid/ANC (optional): ANC entry visible in ISE and DACL applied on switch. (Cisco Community)
- Data Connect (optional): structured tables visible in
index=ise_reports. (Cisco)
Troubleshooting– ISE & Splunk Integration
1. Common Issues & Fixes
Issue 1: Syslog messages not appearing in Splunk
- Symptoms: No ISE authentication/accounting events in Splunk dashboard.
- Checks:
On ISE CLI: show logging application ise-psc.log show logging status
- Verify syslog target in ISE GUI:
Administration → Logging → Remote Logging Targets - Fix:
- Ensure Splunk syslog listener (UDP 514 or TCP 514) is running.
- Check firewall/ACLs between ISE → Splunk server.
Test with nc from ISE: test logging server <Splunk_IP> port 514 facility local6 severity debug
Issue 2: pxGrid connection failure between ISE and Splunk
- Symptoms: Splunk cannot subscribe to pxGrid data.
- Checks:
On ISE CLI: show application status ise | include pxGrid show logging application ise-pxgrid.log
- Verify pxGrid client in ISE GUI under: Administration → pxGrid Services.
- Fix:
- Approve pxGrid client manually in ISE GUI.
- Check certificate trust: Splunk must trust ISE pxGrid CA.
- Re-import pxGrid cert into Splunk.
Issue 3: Time mismatch (logs not correlating)
- Symptoms: Splunk dashboards show wrong time or logs missing.
- Fix:
- Ensure NTP sync on ISE & Splunk:
show ntp - Configure timezone alignment on Splunk (
props.conf).
- Ensure NTP sync on ISE & Splunk:
Issue 4: Duplicate or noisy logs in Splunk
- Symptoms: Same ISE logs appearing multiple times.
- Fix:
- Check if multiple syslog targets are sending to same Splunk index.
- Configure
TRANSFORMS.confin Splunk to deduplicate. - Use filtering on ISE log categories.
Issue 5: Splunk searches not returning ISE events
- Checks:
- In Splunk CLI:
index=ise_logs | head 10 - If empty → logs not indexed.
- In Splunk CLI:
- Fix:
- Check
inputs.confin Splunk (/opt/splunk/etc/system/local/). - Ensure correct sourcetype (e.g.,
cisco:ise:syslog). - Restart Splunk:
./splunk restart
- Check
2. Useful CLI Debugs (ISE Side)
Check syslog queue status: show logging status
Enable syslog debug for test: debug logging application ise-psc.log level debug
Check pxGrid sessions: show application status ise | include pxGrid show logging application ise-pxgrid.log
3. Useful Splunk Search Queries
Show all ISE authentication failures (last 24h): index=ise_logs event_type=3001 OR event_type=5400
Top 10 endpoints by failed authentication: index=ise_logs event_type=3001 | stats count by Calling_Station_ID | sort - count | head 10
Top usernames by authentication success: index=ise_logs event_type=5401 | stats count by User_Name | sort - count | head 10
Correlation with pxGrid feeds (session info): index=ise_logs sourcetype=cisco:ise:syslog session_id=*
4. Validation Checklist
- ISE syslogs visible in Splunk under
cisco:ise:syslog. - pxGrid client from Splunk approved in ISE GUI.
- pxGrid context data (user, endpoint, SGT) visible in Splunk dashboards.
- NTP sync verified between ISE and Splunk.
- Test Splunk dashboards → user login/logoff events appear within seconds.
FAQs – Cisco ISE & Splunk Integration
1. What are the main integration methods between Cisco ISE and Splunk?
Cisco ISE can integrate with Splunk in two ways:
- Syslog Forwarding → ISE forwards syslog events (authentications, accounting, posture, profiling) directly to Splunk.
- pxGrid Integration → Splunk acts as a pxGrid client, subscribing to contextual session data (user, device, SGT, posture, etc.) from ISE.
For complete visibility, both are typically configured together.
2. Which ISE logs should be sent to Splunk for security monitoring?
At minimum, send:
- Authentication logs (success/failure events).
- Accounting logs (session start/stop).
- Posture and profiling logs (endpoint security compliance).
- Threat logs (from integrations like AMP/Talos).
You can adjust the categories under Administration → Logging → Log Categories.
3. How do I verify that ISE syslogs are reaching Splunk?
On ISE CLI: show logging application ise-psc.log show logging status test logging server <Splunk_IP>
- On Splunk GUI:
Run a search: index=ise_logs | head 20
If empty, check syslog port (UDP/TCP 514) and Splunk inputs configuration.
4. Why do Splunk dashboards sometimes show delayed ISE logs?
Possible reasons:
- Syslog over UDP may drop packets (switch to TCP).
- Splunk indexing lag (check Splunk performance).
- Time sync mismatch between ISE & Splunk (verify NTP).
- Splunk props/transforms misconfigured for sourcetype.
5. What is the role of pxGrid in Splunk–ISE integration?
pxGrid enables real-time context sharing.
Splunk can enrich dashboards with:
- User identity (AD username).
- Endpoint profiling (OS, device type).
- Security Group Tags (SGTs).
- Posture status (compliant/non-compliant).
This helps SOC analysts correlate user/endpoint activity with security events.
6. How do I troubleshoot pxGrid client connection issues in Splunk?
Steps:
- Approve pxGrid client in ISE GUI (Administration → pxGrid Services).
- Check pxGrid service status:
show application status ise | include pxGrid - Ensure Splunk trusts the pxGrid CA certificate.
- Review pxGrid logs:
show logging application ise-pxgrid.log
7. How can I filter noisy ISE logs before sending them to Splunk?
- On ISE: Configure selective logging under Log Categories.
- On Splunk: Use
props.confandtransforms.confto drop or route unwanted events.
Example (Splunktransforms.conf):
[drop_noise]
REGEX = .*KeepAlive.*
DEST_KEY = queue
FORMAT = nullQueue
8. Which Splunk apps are recommended for Cisco ISE?
- Splunk Add-on for Cisco ISE → provides field extractions and sourcetypes.
- Cisco ISE Splunk App → dashboards for authentication, posture, threats.
- Cisco Security Suite (legacy) → for cross-Cisco visibility.
9. What performance considerations exist when integrating ISE with Splunk?
- Large ISE deployments generate high syslog volume (millions of events/day).
- Ensure Splunk indexers have enough CPU, memory, and storage.
- Consider using TCP syslog for reliability.
- Implement Splunk clustering for HA in enterprise environments.
10. Can Splunk trigger automated actions based on ISE events?
Yes .
- Splunk Enterprise Security (ES) can detect conditions (e.g., brute-force logins, malware alerts).
- Through pxGrid or ERSE (External RESTful Services), Splunk can trigger actions in ISE such as:
- Quarantine an endpoint.
- Assign a new Security Group Tag (SGT).
- Force reauthentication of a user.
This transforms Splunk + ISE from passive monitoring into active threat response automation.
YouTube Link
For more in-depth Cisco ISE Mastery Training, subscribe to my YouTube channel Network Journey and join my instructor-led classes for hands-on, real-world ISE experience
Closing Notes
- Start with Syslog + TA to get normalized, searchable ISE events within minutes.
- Layer pxGrid/ANC for rapid, analyst-initiated containment straight from Splunk.
- Add Data Connect for governed reporting at scale (audits, KPIs).
- Always validate in three planes: ISE (Log Target + Live Logs), Splunk (index/fields), and Network (switch/WLC session state).
Upgrade Your Skills – Start Today
“For more in-depth Cisco ISE Mastery Training, subscribe to my YouTube channel Network Journey and join my instructor-led classes.”
Fast-Track to Cisco ISE Mastery Pro
I run a focused 4-month, instructor-led ISE + Security automation program (labs first, production patterns, interview-ready).
Get the full outline and enroll: https://course.networkjourney.com/ccie-security/.
What you’ll get: live labs (EVE-NG/VMware), Splunk + ISE blueprints, pxGrid/ANC playbooks, ERS/MnT scripting kits, and graded capstone with reviewer feedback.
Bonus for Splunk chapter: ready-to-import SPL dashboards, Data Connect report packs, and pxGrid ANC alert actions.
Enroll Now & Future‑Proof Your Career
Email: info@networkjourney.com
WhatsApp / Call: +91 97395 21088
![[Day 23] Cisco ISE Mastery Training: Guest VLAN & Critical VLAN Configuration](https://networkjourney.com/wp-content/uploads/2025/08/Day-23-Cisco-ISE-Mastery-Training-Guest-VLAN-Critical-VLAN-Configuration.png)