Trainer Sagar Dhawan
- Posted on
[Day 90] Cisco ISE Mastery Training: Integrating with SIEM Solutions
Table of Contents
Introduction
When Cisco ISE is the source of truth for identity, posture, and policy, your SIEM is the source of detection, investigation, and response. This day turns you into the glue: you’ll wire ISE to multiple SIEMs (Splunk, QRadar, Microsoft Sentinel, Elastic, ArcSight) using reliable syslog pipelines, enrich with pxGrid context and enable closed-loop actions (ANC quarantine/CoA) straight from the SIEM. You’ll build production-grade logging targets, parsers, dashboards, and validation in GUI + CLI + SIEM queries—all in one lab.
Problem Statement
- Security teams need continuous visibility of authentications, device profiles, posture compliance, and TrustSec decisions outside ISE.
- Live Logs don’t scale for cross-domain correlation (EDR/NGFW/DNS/Email).
- Incident responders want one console to investigate & respond (quarantine, CoA, ticketing) with audit-proof history and retention.
- Engineering needs normalized fields for detections and repeatable pipelines (HA, TLS, back-pressure, noise control).
Solution Overview
Integration patterns you will build:
- Baseline Ingestion (Required)
ISE → Remote Logging Targets → (UDP/TCP syslog, optionally TLS via a collector) → SIEM data inputs. Map ISE Logging Categories (AAA, Accounting, Posture, Profiler, Client Provisioning, Admin Audit) to the SIEM. - Context & Response (Advanced)
SIEM → pxGrid (subscribe to sessions/attributes) and ERS/MnT/ANC APIs (enforce quarantine, clear quarantine, trigger CoA). - Reporting at Scale (Optional)
ISE Data Connect (3.2+) for structured reporting tables to the SIEM (dashboards/KPIs) without message parsing.
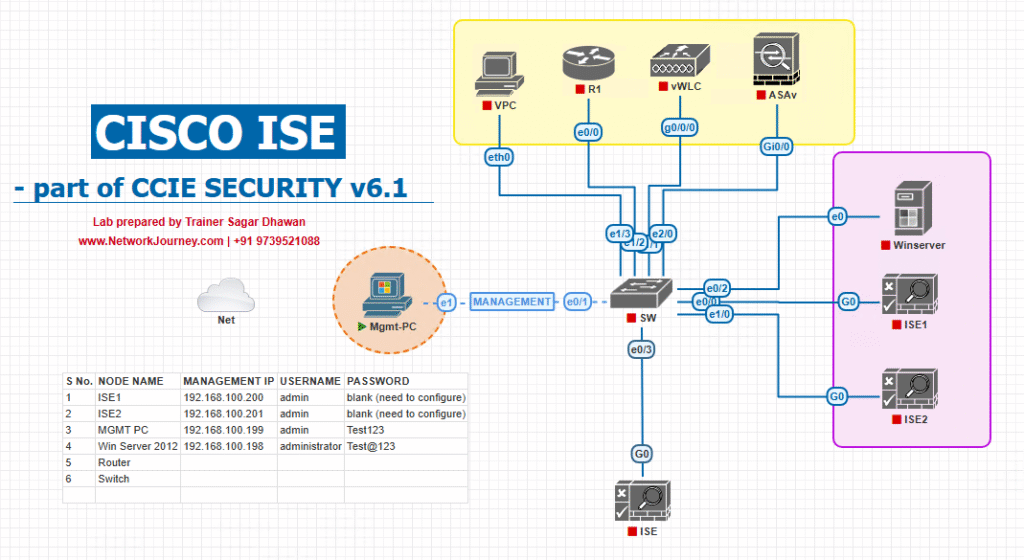
Sample Lab Topology
Platform: VMware (ISE & SIEM VMs) + EVE-NG (NADs).
Nodes:
- ISE-PAN/MnT/pxGrid:
10.10.10.10 - ISE-PSN:
10.10.10.11 - Syslog/Collector (rsyslog/syslog-ng, optional TLS):
10.10.20.20 - SIEM options (pick 1–2 for the lab, keep others powered off):
- Splunk AIO:
10.10.20.21 - QRadar Console:
10.10.20.22 - Linux AMA Agent (for Sentinel):
10.10.20.23 - Elastic Stack (Logstash/Filebeat/Kibana):
10.10.20.24 - ArcSight SmartConnector:
10.10.20.25
- Splunk AIO:
- NAD (Wired) Cat9K:
10.10.30.30 - WLC 9800-CL:
10.10.30.40 - Endpoints: Win10, macOS, iOS/Android, IP Phone, Printer/IoT
Topology Diagram:
Step-by-Step GUI Configuration Guide (with CLI + Validation)
Part A — ISE: Build Reliable Logging Targets (Common for All SIEMs)
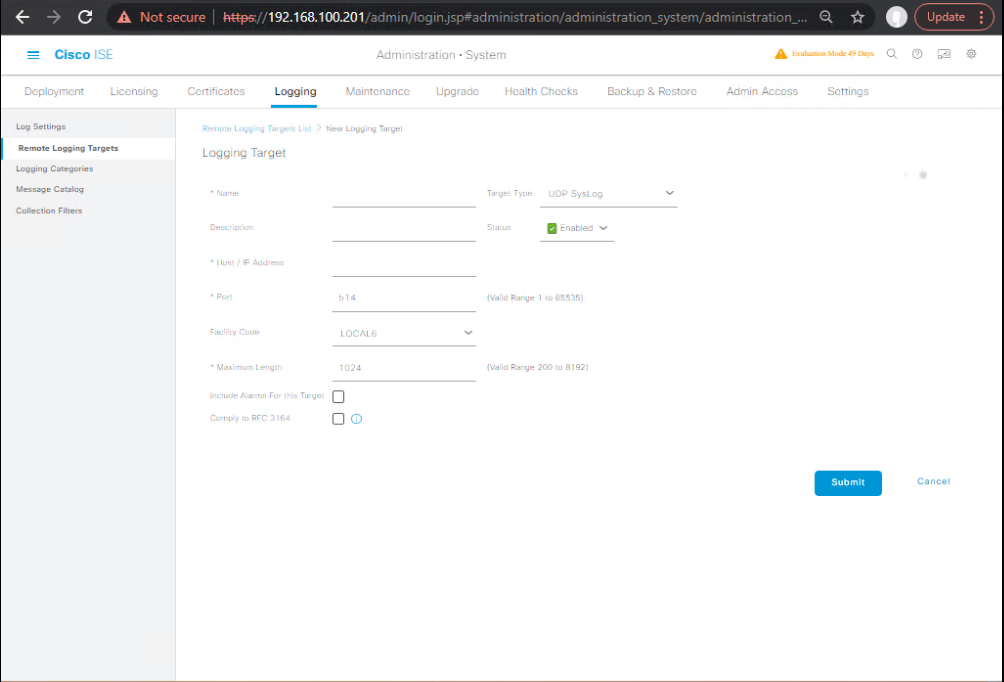
- Create Remote Logging Target
- ISE GUI → Administration → System → Logging → Remote Logging Targets → Add
- Name:
SIEM-Collector - Protocol: TCP (recommended). If your SIEM needs TLS, point ISE to a local collector that forwards to SIEM over TLS 6514.
- Server:
10.10.20.20(collector) or direct SIEM IP. - Port:
514(TCP) or6514(TLS via collector). - [Screenshot: ISE Add Remote Logging Target]
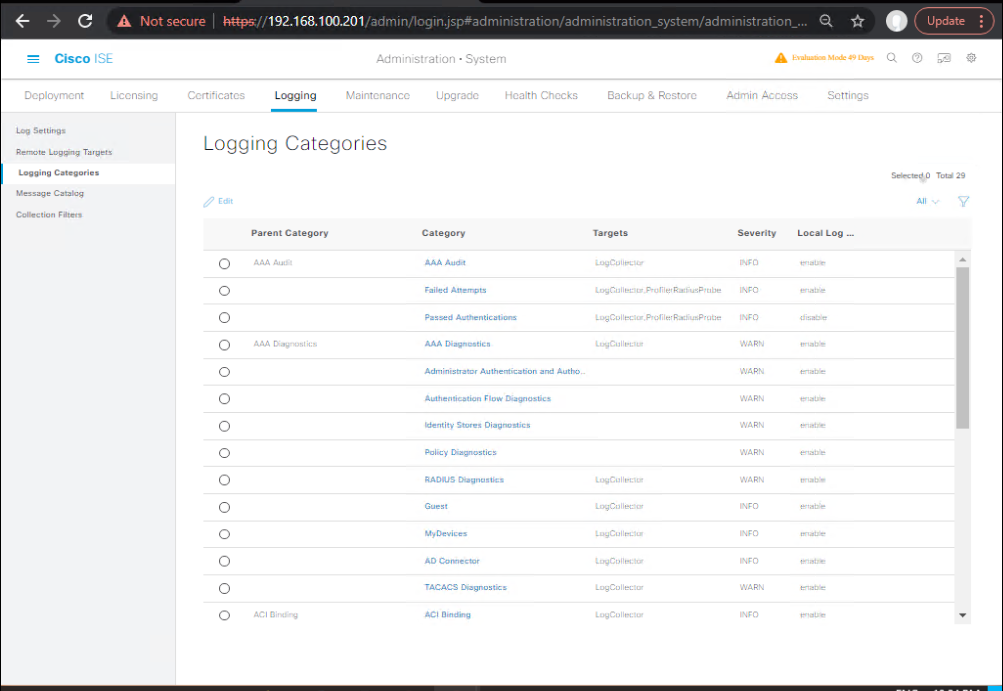
- Map Logging Categories → Target
- ISE GUI → Administration → System → Logging → Logging Categories
- For each: AAA Audit, RADIUS Accounting, Posture, Profiler, Client Provisioning, Admin Audit
- Severity:
Informational(adjust as needed) - Targets: SIEM-Collector
- Severity:
- [Screenshot: ISE Logging Categories Mapping]
- (Optional) Message Format Tuning
- Use consistent Hostname, FQDN, or IP as log identifier.
- Keep RFC-compliant timestamps (default is good).
- [Screenshot: ISE Logging Preferences]
- ISE Side Validation
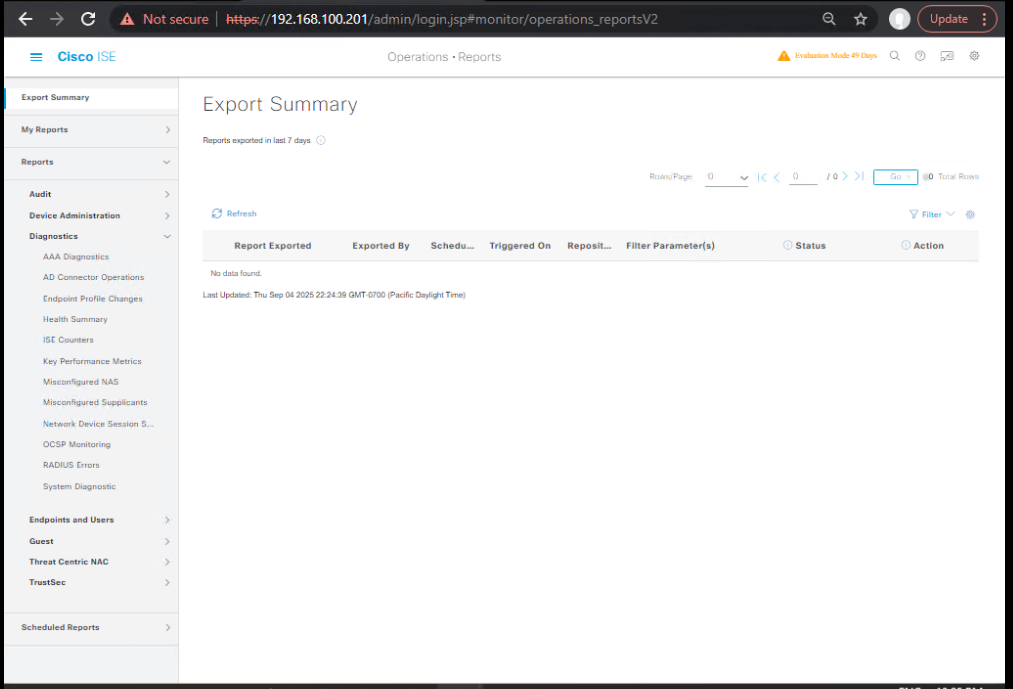
- Operations → Reports → Diagnostics → Log Target Status: Packets Sent increasing, Drops = 0.
- [Screenshot: ISE Log Target Status]
- CLI: Quick Health Checks (ISE SSH)
show application status ise show logging status show logging application ise-psc.log | include ERROR|WARN show logging application ise-ims.log | include ERROR|WARN show ntp - Generate Test Events
- Switch (Cat9K) CLI (force a reauth):
conf t interface Gi1/0/10 authentication control-direction in authentication event server dead action authorize vlan 999 dot1x reauthentication end clear authentication sessions interface Gi1/0/10 - Or bounce the port:
conf t interface Gi1/0/10 shut no shut end
- Switch (Cat9K) CLI (force a reauth):
- ISE Live Logs Check
- Operations → RADIUS → Live Logs: Confirm the test endpoint re-auth hits, action, and policy matched.
- [Screenshot: ISE Live Logs View]
Part B — Splunk Recipe (if you choose Splunk)
- Splunk Index & Inputs
- Settings → Indexes → New:
ise - Settings → Data Inputs → TCP/UDP 514: Index=
ise, Sourcetype=cisco:ise:syslog - [Screenshot: Splunk Data Input]
- Settings → Indexes → New:
- (Recommended) Splunk Add-on for Cisco ISE
- Deploy on parsing tier (HF/Indexer) and Search Head.
- Validates timestamps and extracts fields (user, mac, nas_ip, result, profile).
- Validation (SPL)
index=ise sourcetype=cisco:ise:syslog | head 20- Expect fresh events after your port bounce/reauth.
- Troubleshooting
index=_internal sourcetype=splunkd (tcpin OR metrics) | stats sum(kb) by series- If zero, inspect firewall/inputs and btool props for sourcetype.
Part C — IBM QRadar Recipe
- Create a Log Source
- QRadar GUI → Admin → Log Sources → Add
- Log Source Type:
Cisco ISE - Protocol:
Syslog(UDP/TCP per your collector) - Log Source Identifier: ISE-PSN IP (
10.10.10.11) - Coalescing Events: Off (for lab), On (for prod as needed)
- [Screenshot: QRadar New Log Source – Cisco ISE]
- Receiver / Port
- Ensure ecs-ec-ingress is listening on
514(UDP/TCP) or your chosen port. - If using a TLS syslog gateway, register it as the sender.
- Ensure ecs-ec-ingress is listening on
- Validation (QRadar)
- Log Activity: filter by Log Source = Cisco ISE.
- Quick AQL (Log Activity → Advanced):
SELECT "sourceip", "username", "devicetime", "qidname" FROM events WHERE logsourcetype='Cisco ISE' ORDER BY devicetime DESC LIMIT 25
- Tuning
- Create Custom Properties if needed (e.g., extract
Calling-Station-ID,NAS-Port-Id). - Build Saved Searches/Rules: Excessive failures by MAC, Non-compliant posture, ANC applied.
- Create Custom Properties if needed (e.g., extract
Part D — Microsoft Sentinel Recipe (Syslog via AMA)
- Linux Collector for Syslog
- Pick
10.10.20.23as Syslog/AMA Agent. - Configure rsyslog to accept ISE over TCP 514 and write to
/var/log/syslog.
- Pick
- Connect to Sentinel
- Install Azure Monitor Agent (AMA) on the Linux host.
- In Sentinel / Data Connectors: enable Syslog.
- Create a Data Collection Rule (DCR): collect facility/priority used by ISE into your Log Analytics workspace.
- Validation (KQL in Sentinel)
Syslog | where Hostname == "ise-psn.lab.local" or HostIP == "10.10.10.11" | where ProcessName contains "ise" or SyslogMessage contains "RADIUS" | take 25 - Dashboards / Analytics
- Build Workbook with tiles: Auth successes/failures over time, Top failed MACs, Posture non-compliant count.
- Create Analytics Rule: multiple failures by same MAC within 5 minutes → Automation Rule to call ISE ANC (via Logic App + ERS/pxGrid).
Part E — Elastic Stack Recipe (Logstash/Filebeat)
- Input Options
- Logstash: syslog input on TCP 514; use Grok patterns to parse ISE fields.
- Filebeat:
inputs.syslog→ Logstash/Elasticsearch.
- Minimal Logstash Pipeline
/etc/logstash/conf.d/30-ise.conf:input { tcp { port => 514 type => "ise_syslog" codec => "line" } } filter { grok { match => { "message" => "%{SYSLOGTIMESTAMP:syslog_ts} %{HOSTNAME:host} %{DATA:app}: %{GREEDYDATA:ise_msg}" } } # Add additional grok for user/mac/nas_ip/failure_reason as needed } output { elasticsearch { index => "ise-%{+YYYY.MM.dd}" } }
- Validation (Kibana)
- Discover → Index
ise-*→ filterise_msg:*RADIUS* - Lens/TSVB: Failures over time, Top MACs, Top NAS-Port-Id.
- Discover → Index
Part F — ArcSight Recipe (SmartConnector)
- Install SmartConnector (Syslog Daemon) on
10.10.20.25- Device Vendor:
Cisco - Device Product:
Identity Services Engine - Receiver: UDP/TCP 514
- Forward to ESM/Logger.
- Device Vendor:
- Validation
- Active Channel: filter by
Device Product = Identity Services Engine - Columns:
Device Event Class ID,Name,Source Address,Destination Address,Source User Name,Device Custom String (MAC).
- Active Channel: filter by
- Correlations
- Rules: multiple failures by same MAC, posture non-compliant endpoints → send notification & Trigger REST to ISE ANC.
Part G — Optional: pxGrid + ANC from the SIEM
Quarantine endpoints from the SIEM on a detection.
- Enable pxGrid on ISE (node with pxGrid role)
- Administration → Deployment → select PAN → Enable pxGrid.
- Ensure system certificate supports client auth; export pxGrid cert chain to the SIEM client.
- SIEM pxGrid Client / Orchestration
- Register a client that can: subscribe to session directory, invoke ANC or ERS.
- Store credentials/certs securely; restrict by IP.
- Validation
- In ISE: Operations → Adaptive Network Control shows Apply/Clear events.
- On switch:
show authentication sessions interface Gi1/0/10 detailsConfirm DACL/VLAN changed due to ANC.
Part H — End-to-End Validation Matrix (tick each)
- ISE → Target link up: Log Target Status shows sent↑ / drops=0.
- SIEM ingest: Fresh events visible within 10–30s of a test reauth.
- Field extraction: username, MAC, NAS-IP, result/failure-reason accessible via SIEM fields.
- Dashboards: failures over time, top failing MACs, posture non-compliance.
- Response (optional): ANC applied, switch shows new DACL/VLAN; session reauth observed in Live Logs.
Troubleshooting:
- Common Integration Issues
- Syslog export not reaching SIEM
- Wrong facility/port
- pxGrid authentication failures
- Time sync/NTP mismatch
- SIEM parsing errors (Splunk CIM/QRadar DSM/ArcSight parser)
- Certificate trust issues
- Error Log Samples
- ISE Live Logs (
show logging application ise-psc.log) - FMC/ISE pxGrid failure messages
- SIEM log parsing failure examples
- ISE Live Logs (
- Debug & Validation Commands (ISE CLI)
show logging system tailshow application status isetcpdumpexamples for port 514/6514/pxGrid- pxGrid connection check (
pxGrid-clientvalidation script)
- GUI Validation Steps
- ISE → Operations → Reports → ensure syslog export is hitting SIEM
- SIEM console (Splunk search query examples:
index=ise sourcetype=cisco:ise)
- Quick Fixes & Root Cause Mapping Table
- Symptom → Root Cause → Fix (like a CCIE workbook style)
- Golden Checklist (pre-check before calling it “integrated”)
- NTP sync
- CA trust chain installed
- Syslog test message validated
- pxGrid client authenticated
- SIEM parsing normalized
FAQs – Cisco ISE with SIEM Integration
1. Q: Which SIEM solutions are officially supported with Cisco ISE?
A: Cisco ISE integrates with any SIEM that supports syslog, but Cisco validates most heavily with Splunk, QRadar, and ArcSight. For Splunk, Cisco provides an ISE add-on app for CIM compatibility. For QRadar, use the Cisco ISE DSM parser. For ArcSight, a custom parser is usually required.
2. Q: Which log formats can ISE send to a SIEM?
A:
- Syslog (UDP 514 / TCP 514 / TLS 6514) → main method.
- pxGrid → for context sharing with SIEM (user/IP/device posture data).
- REST API → pull/push for custom integrations.
Most SIEMs primarily use syslog, but pxGrid adds identity awareness beyond logs.
3. Q: How do I verify that logs are leaving ISE and reaching the SIEM?
A:
- On ISE:
show logging system tail tcpdump -i eth0 port 514→ to confirm syslog export. - On SIEM: Run a search query (e.g., in Splunk:
index=ise sourcetype=cisco:ise) and validate. - GUI: Navigate to Operations → Reports → Log Export and check syslog status.
4. Q: What’s the difference between exporting ISE logs vs pxGrid context to SIEM?
A:
- Log Export (Syslog) = Security events (authentication, authorization, posture).
- pxGrid Context = User/endpoint identity, group memberships, posture state, threat feeds.
Together, they provide complete visibility: logs show events, pxGrid shows who/what/where context.
5. Q: What is the minimum logging configuration required in ISE for SIEM?
A:
- Create a Remote Logging Target → define SIEM IP + port.
- Map it under System → Logging Categories (e.g.,
Passed Authentication,Failed Authentication,Posture). - Ensure TLS/SSL syslog if required (6514).
- Enable debug mode for troubleshooting if no logs appear.
6. Q: How do I troubleshoot if the SIEM is not parsing ISE logs correctly?
A:
- Verify syslog format (ISE default uses RFC 5424).
- Check SIEM parser/DSM mapping (e.g., Splunk CIM, QRadar DSM).
- Compare raw logs vs parsed fields (usernames, IPs, device types).
- Adjust normalization on SIEM side.
- Use ISE’s Test Syslog Message feature to validate parser compatibility.
7. Q: Can I secure the ISE → SIEM log channel?
A: Yes.
- TLS Syslog (port 6514) ensures encryption.
- Requires mutual certificate trust between ISE and SIEM.
- Best practice: always use TLS in production to avoid log tampering/sniffing.
8. Q: How do I confirm pxGrid connectivity between ISE and SIEM?
A:
- On ISE: Administration → pxGrid Services → Clients → confirm SIEM registered as a pxGrid client.
- CLI:
show application status ise tcpdump -i eth0 port 8910 - SIEM: Look for identity context events (e.g., Splunk search:
tag=identity ise).
9. Q: How do I test log volume and performance impact when integrating with SIEM?
A:
- Use ISE’s live logs to estimate EPS (Events Per Second).
- On SIEM: check ingestion rate (Splunk →
index=ise | timechart count by sourcetype). - Scale ISE logging nodes if SIEM reports dropped packets.
- Rule of thumb: 1 ISE node handles ~25k EPS (depending on hardware).
10. Q: What are best practices for SIEM integration with ISE?
A:
- Always enable NTP sync (log correlation depends on timestamps).
- Use TLS syslog instead of UDP.
- Export only required categories (avoid flooding SIEM with irrelevant events).
- Test with sample searches in SIEM (Splunk CIM fields or QRadar rules).
- Use pxGrid alongside syslog for richer threat response workflows.
YouTube Link
For more in-depth Cisco ISE Mastery Training, subscribe to my YouTube channel Network Journey and join my instructor-led classes for hands-on, real-world ISE experience
Closing Notes
You just built a portable, repeatable ISE→SIEM pipeline with category mapping, parsing, dashboards, and response. Your SOC can now search identities in seconds, prove posture/authorization decisions, and act (ANC/CoA) from the SIEM. In production, emphasize TCP/TLS, queuing, field normalization, and runbooks. Validate everything in three planes: ISE (Live Logs/ANC), SIEM search, and NAD CLI.
Upgrade Your Skills – Start Today
“For more in-depth Cisco ISE Mastery Training, subscribe to my YouTube channel Network Journey and join my instructor-led classes.”
Fast-Track to Cisco ISE Mastery Pro
I run a focused 4-month instructor-led program that takes you from NAC fundamentals → TrustSec → pxGrid → Automation with production-grade labs (Splunk/QRadar/Sentinel/Elastic/ArcSight).
Get the full outline & enroll: https://course.networkjourney.com/ccie-security/.
What you get: end-to-end lab kits, SIEM dashboards, pxGrid/ANC playbooks, ERS/MnT code templates, graded capstones, and interview prep.
Enroll Now & Future‑Proof Your Career
Email: info@networkjourney.com
WhatsApp / Call: +91 97395 21088

![[Day 25] Cisco ISE Mastery Training: Dynamic VLAN Assignment in Wired Networks](https://networkjourney.com/wp-content/uploads/2025/08/Day-25-Cisco-ISE-Mastery-Training-Dynamic-VLAN-Assignment-in-Wired-Networks.png)