Trainer Sagar Dhawan
- Posted on
[Day 99] Cisco ISE Mastery Training: Performance Tuning
Table of Contents
Introduction
Performance tuning in Cisco Identity Services Engine (ISE) is not a luxury — it is the difference between a stable NAC deployment and a production outage at scale.
While most engineers focus on policies, authentication, and certificates, many underestimate the engine under the hood: CPU cycles, memory allocation, database health, logging queues, and session handling capacity.
In real-world enterprise environments:
- A single mis-sized ISE node or untuned logging policy can delay authentications by several seconds.
- A burst of endpoint connections (e.g., morning login storm, Wi-Fi reconnections) can overwhelm poorly tuned ISE clusters.
- If Profiling, Posture, and PxGrid are not optimized, they can consume disproportionate resources and starve mission-critical RADIUS transactions.
- Many outages in NAC deployments aren’t caused by bad policy, but by poorly tuned ISE performance parameters.
This module, Day 99 – Cisco ISE Mastery Training: Performance Tuning, is designed as a step-by-step engineering workbook.
I will build a performance baseline, identify tuning levers in ISE, and practice real-time validation using GUI and CLI. By the end of this lab, you will be able to:
- Size and tune ISE nodes for your environment (AuthC/AuthZ/Profiling).
- Configure logging, purge policies, and monitoring thresholds.
- Validate performance tuning in both ISE GUI (Operations → Reports/Monitoring) and ISE CLI (ise/var/logs + show commands).
- Troubleshoot slow authentications, high CPU, and DB bottlenecks.
Problem Statement
Common pain we must fix systematically:
- High auth latency / timeouts (RADIUS dead, AD slow, TLS handshake slowness).
- PSN CPU spikes / memory pressure during posture or AD outages.
- PAN GUI sluggishness, long saves/commits.
- MnT bloat (slow reports/live logs due to unbounded retention).
- Profiling storms (too many probes; unnecessary CoAs).
- CoA / reauth storms from aggressive NAD timers.
- Load-balancer stickiness issues (hot PSN, cold PSN).
- Replication lag → policy mismatches across PSNs.
Solution Overview
We tune ISE in layers:
L1 – Platform & OS (VM/Appliance hygiene): CPU/mem reservation, vmxnet3, NTP/DNS reachability.
L2 – Policy & Crypto: tight Allowed Protocols, efficient conditions, EAP-TLS optimization.
L3 – Services: MnT purge, logging levels, profiling probes, posture timers, pxGrid scope.
L4 – Identity: AD site affinity, GC usage, timeouts/retries.
L5 – Network Edges (NAD/LB): RADIUS timers, accounting intervals, LB health/persistence.
L6 – Validation & Observability: Live Logs latency, RADIUS statistics, PSN health CLI, hit counters, policy trace.
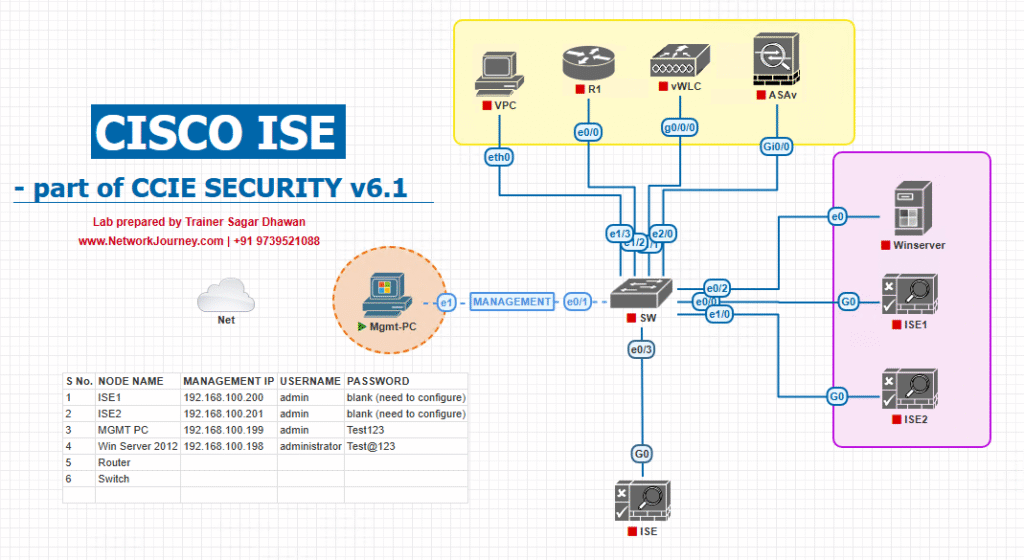
Sample Lab Topology (VMware / EVE-NG)
Compute / VMs
- ISE-PAN/MnT (Primary), ISE-PSN1, ISE-PSN2
- AD/GC + ADCS (CA)
- Linux SFTP (repo for backups/logs)
- Jump host (OpenSSL/curl), Test clients: Windows 11, macOS, iPhone
Network
- Catalyst 9300 (wired 802.1X/MAB)
- WLC 9800 + AP (SSIDs: Corp-8021X, Guest-Portal)
- Optional RADIUS LB in front of PSNs
Step-by-Step GUI Configuration Guide
A) Baseline & Instrumentation (Measure before changing)
Checklist – Capture Current State
- ISE services up:
show application status ise show cpu show memory show disk - Deployment health (GUI): Administration → System → Deployment (all Green).
- Live Logs latency snapshot: Operations → RADIUS → Live Logs → add column Elapsed Time → export 15–30 min window.
- PSN throughput (NAD side):
- Catalyst:
show radius statistics show aaa servers clear radius statistics - WLC 9800:
show radius summary
- Catalyst:
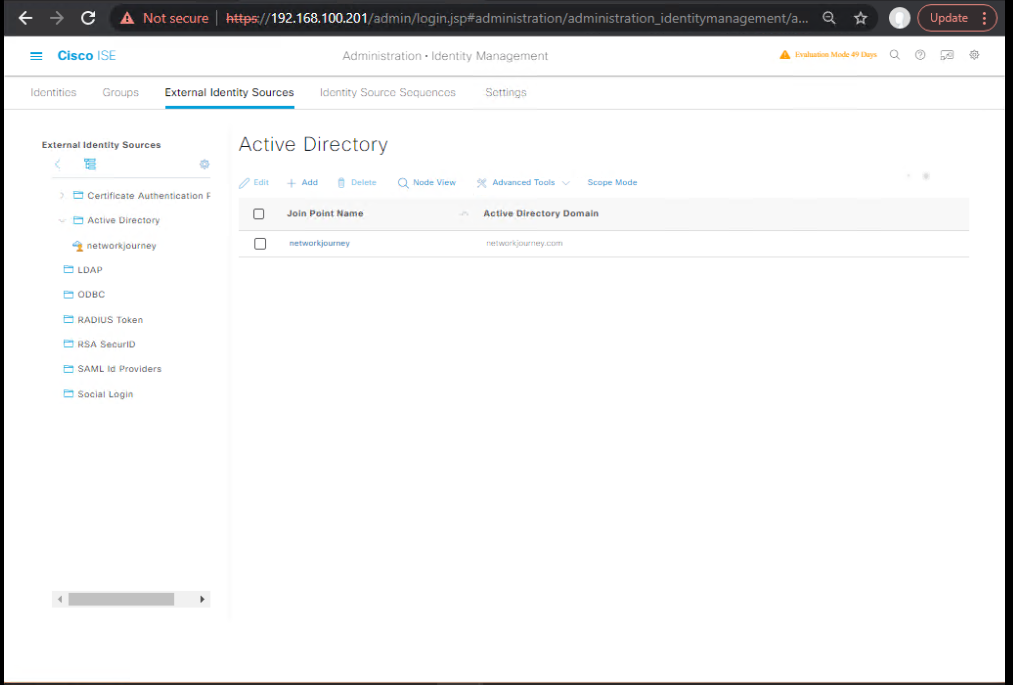
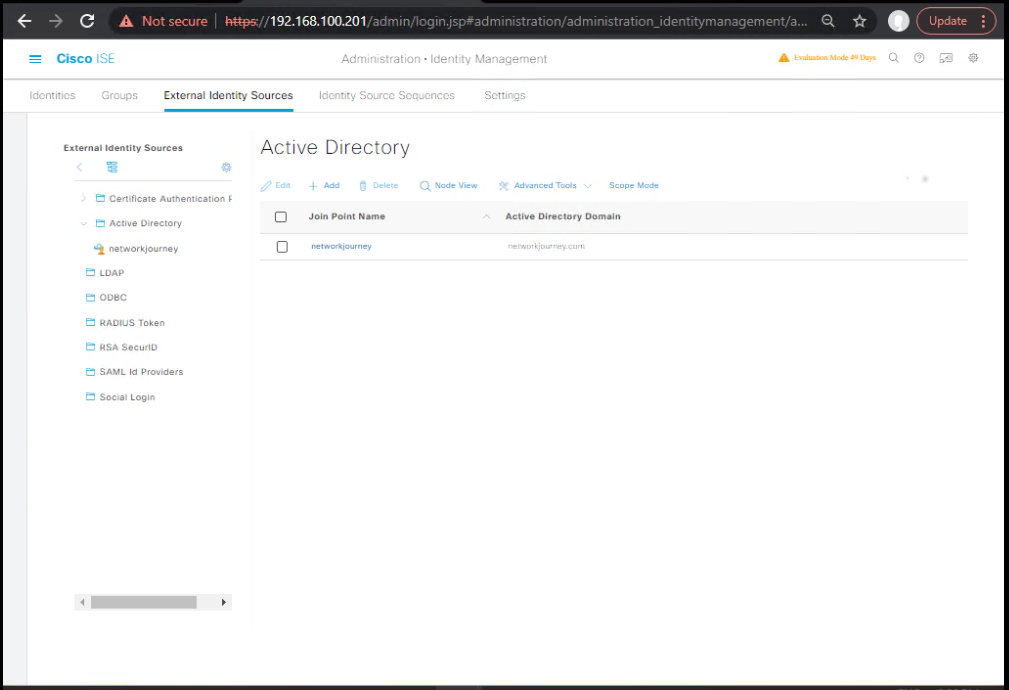
- AD latency (ISE to DCs): Administration → Identity Management → External Identity Sources → Active Directory → Diagnostics.
B) Platform & VM Hygiene (PSN/PAN/MnT)
- VM Hardware / Host
- Reserve CPU & Memory for PSNs (avoid overcommit).
- Use vmxnet3 NICs.
- Ensure Datastore latency < 5–10 ms sustained.
- Time sync: NTP reachable & consistent.
Validation
show ntp
show dns
show tech system
C) Policy Engine Efficiency
- Allowed Protocols – tighten
- GUI: Administration → System → Settings → Protocols or Policy → Policy Sets → [Set] → Allowed Protocols.
- Create Custom Allowed Protocols (e.g., only EAP-TLS, PEAP-MSCHAPv2, MAB actually used; remove unused like LEAP).
- Why: Less negotiation/handshake work per request.
Validation
- Live Logs → confirm Tunnel/Inner methods match expectations.
- Switch/WLC debugs show accepted methods (see debug snippets below).
- Policy Conditions – simplify & order
- GUI: Policy → Policy Sets
- Use NDG (Network Device Groups) to route requests to the correct set (Site/Device Type) before detailed rules.
- Replace regex with equals/in-list where possible.
- Keep specific → general → default order; enable Hit Counters.
Validation
- Observe Hit Counters increasing on expected rules.
- Policy Trace (Live Log → Details → Policy tab) shows matched conditions.
- Authorization Results – minimize CoA
- Prefer dACL/SGT over constant VLAN flips when possible.
- Use Reauth = No unless posture/registration really needs it.
Validation
- Switch:
show authentication sessions interface Gi1/0/10 details show access-lists dynamic - Live Logs → check fewer CoA events.
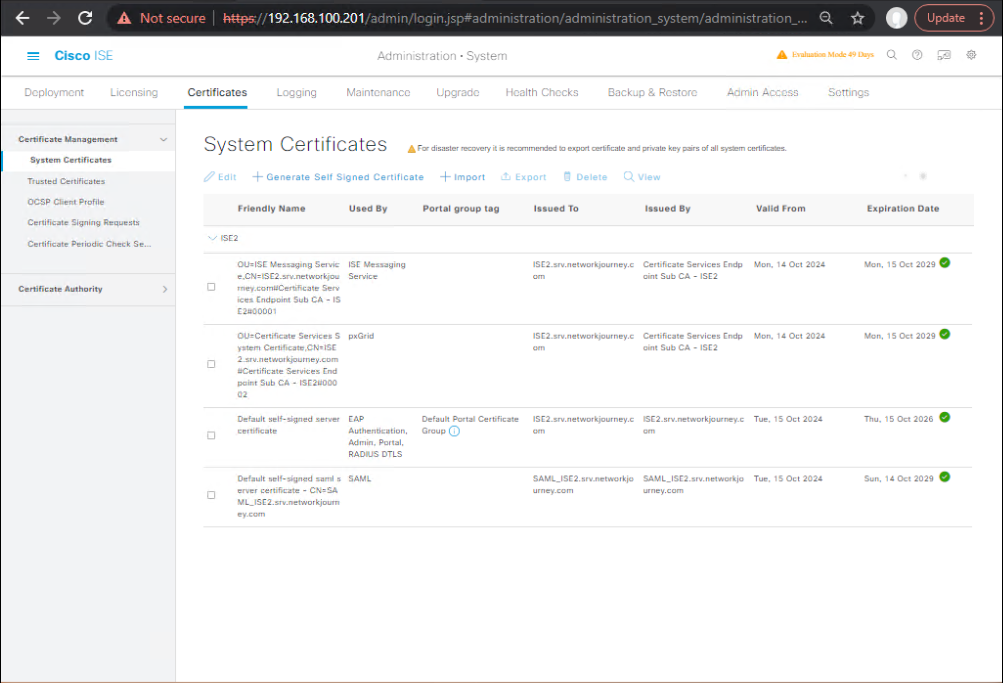
D) Certificates & EAP-TLS handshake tuning
- Chain completeness & OCSP/CRL reachability
- GUI: Administration → System → Certificates
- Ensure Root & Intermediates installed under Trusted Certificates.
- Ensure EAP/Portal cert bound to PSNs.
- Keep CRL/OCSP endpoints reachable to avoid handshake stalls.
Validation
openssl s_client -connect <PSN-FQDN>:443 -showcerts </dev/null | openssl x509 -noout -issuer -subject
- Live Logs → check Step: TLS handshake timings.
E) Active Directory Efficiency
- Join & Sites
- GUI: Identity Management → External Identity Sources → Active Directory
- Ensure node Joined.
- In Advanced Settings, prefer closest DCs/GCs (Site affinity).
- Enable machine auth caching (per session by design).
Validation
- AD Diagnostics (Test User).
- CLI:
show logging application ise-psc.log | include ad
F) MnT (Monitoring) – Purge & Logging
- Set Purge Policies
- GUI: Administration → System → Settings → Purge (or Maintenance → Purge, depending on version)
- Define retention days for RADIUS/TACACS/Posture records to match storage.
- Enable automatic purge.
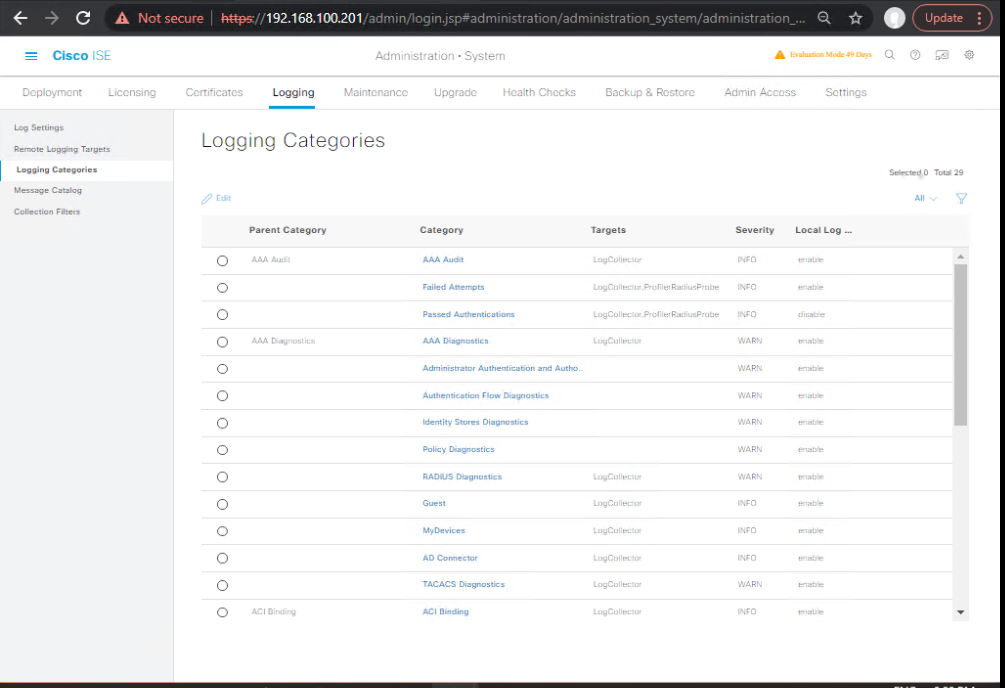
- Logging Levels
- GUI: Administration → System → Logging → Log Categories
- Keep at INFO in production. Use DEBUG only during short troubleshooting windows.
Validation
- GUI: Operations → Reports load time improved.
- CLI:
show disk show logging application
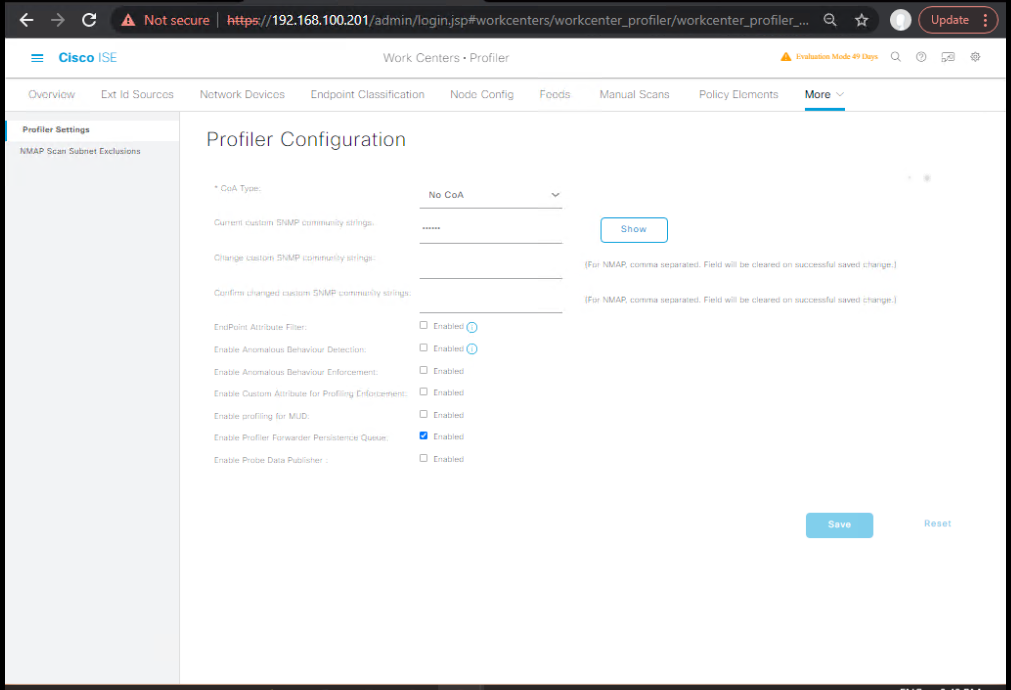
G) Profiling – Reduce Noise
- Probe selection
- GUI: Work Centers → Profiler → Settings
- Enable only necessary probes (RADIUS, DHCP, SNMP, HTTP) for your environment.
- Disable NetFlow/IF-MAP/ERSPAN if unused.
- Avoid profiling CoA unless strictly needed.
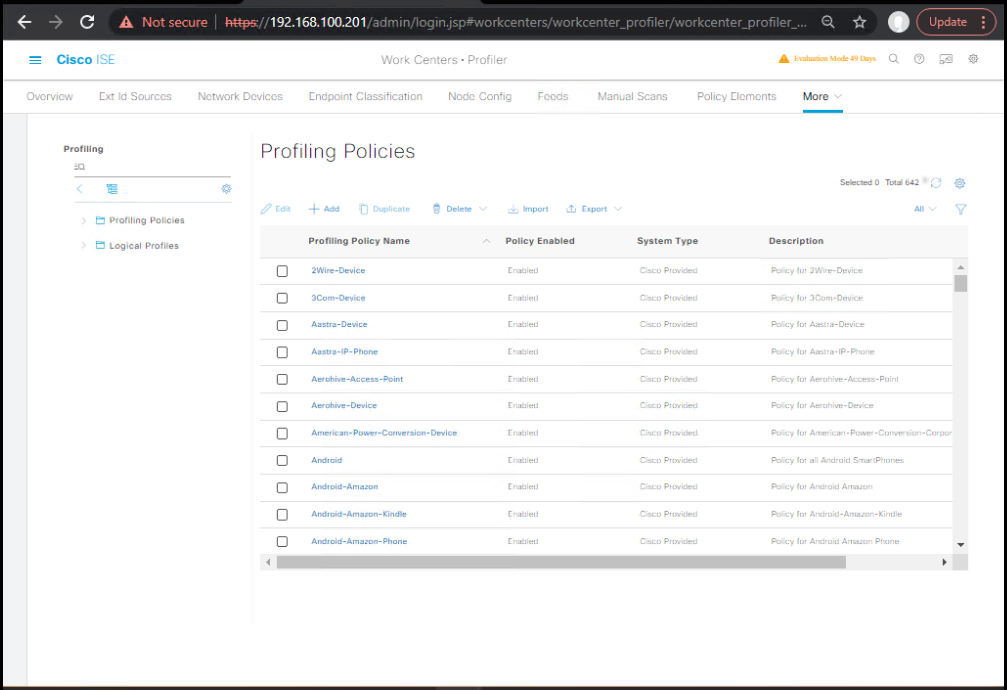
- Profile Policy order
- GUI: Work Centers → Profiler → Profiling Policies
- Order specific signatures above generic to minimize evaluations.
Validation
- Live Logs → fewer “Profile updated” events.
- PSN CPU steadier during endpoint churn.
H) Posture – Control Reassessment & CoA
- Posture Reassessment
- GUI: Policy → Posture
- Set Reassessment to reasonable intervals (e.g., 12–24h, not minutes).
- Use Low-impact redirects and limited dACL during Non-Compliant.
Validation
- Live Logs: ensure NonCompliant → Compliant transitions with one CoA per cycle.
- Endpoint agent shows expected Reassessment interval.
I) pxGrid – Scope & Keepalives
- Client scope
- GUI: Work Centers → pxGrid Services → Client Management
- Approve only necessary clients; limit to needed topics.
- Avoid excessive bulk pulls during business hours.
Validation
- pxGrid clients show Online; PSN CPU stable.
[Screenshot: pxGrid – Client Management]
J) Replication & Database Health
- Replication status
show replication status
- Must be SUCCESS on all nodes.
- Keep policies consistent
- After bulk changes, give time for sync before a load test.
Validation
- GUI: Administration → System → Deployment → Replication Status.
K) NAD (Switch/WLC) Timers & RADIUS Behavior
Catalyst (example)
aaa new-model
radius server ISE1
 address ipv4 <PSN1>
 key <secret>
radius server ISE2
 address ipv4 <PSN2>
 key <secret>
aaa group server radius ISE-GRP
 server name ISE1
 server name ISE2
aaa authentication dot1x default group ISE-GRP
aaa authorization network default group ISE-GRP
aaa accounting update periodic 15
aaa accounting dot1x default start-stop group ISE-GRP

dot1x system-auth-control
interface Gi1/0/10
 authentication order mab dot1x
 authentication priority dot1x mab
 authentication port-control auto
 mab
 authentication periodic
 authentication timer reauthenticate 3600
 dot1x timeout tx-period 10
 dot1x max-reauth-req 3
 spanning-tree portfast
WLC 9800 (snippets)
aaa servers radius
 radius server <PSN1-IP> auth-port 1812 acct-port 1813 key 7 <secret>
 radius server <PSN2-IP> ...
radius load-balance disable  ! (or enable per design)
aaa deadtime 10
Validation
# Catalyst
show radius statistics
show authentication sessions
show aaa servers
# WLC
show radius summary
show client detail <mac>
- Watch: avoid too-frequent
aaa accounting update periodicintervals; set ~15 min unless you need granular accounting.
L) Load-Balancer (LB) for PSNs – Health & Persistence
- Health check: Real RADIUS Access-Request/Access-Accept style probes (not just TCP/ICMP).
- Persistence: Stick by Calling-Station-ID or Framed-IP (per session), not by NAT’d source IP.
- Timeouts: LB timeout < NAD timeout, so LB fails over before NAD gives up.
Validation
- LB shows both PSNs healthy; client authentications distribute evenly.
- On PSNs,
show logging application ise-radius.logshows balanced traffic (per PSN).
M) After-Tuning Validation (Golden Tests)
GUI
- Live Logs median Elapsed Time improves.
- Deployment Green; Replication SUCCESS.
- Reports load faster; purge jobs executed.
CLI – ISE
show application status ise
show cpu
show memory
show disk
show replication status
show logging application | include (radius|replication|ad|posture|pxgrid|error)
CLI – Catalyst/WLC
show radius statistics
show aaa servers
show authentication sessions
show client detail <mac>
Performance Tuning Validation Matrix:
| Tuning Area | What to Check | How to Validate (GUI) | How to Validate (CLI) | Expected Outcome |
|---|---|---|---|---|
| System Health (CPU/Memory) | Verify ISE node resources are not overloaded | Administration → System → Deployment → Node Status [Screenshot: Node Status GUI] | show cpu usage show memory statistics | CPU < 70% avg, Memory < 75% sustained |
| Disk Utilization | Check DB/log storage | Administration → System → Logging → Local Log Storage | show disk | ≥ 20% free disk space; alert thresholds not exceeded |
| Database Performance | Check for DB bottlenecks (Postgres) | Operations → Reports → System → ISE Database Status | show application status ise ise-db-replication | DB running healthy, no replication lag |
| RADIUS Auth Throughput | Validate peak authentication handling | Operations → Reports → Authentication → RADIUS Live Logs [Screenshot: RADIUS Logs] | Monitor live via: tail -f /var/log/radius.log | RADIUS auth delay < 300ms; no dropped packets |
| Session Concurrency | Validate concurrent sessions capacity | Operations → Reports → Endpoints and Users → Active Sessions | show session counts | Sessions scale as per node sizing (e.g., 50k per PSN) |
| Profiling Services | Ensure profiling probes not overloading system | Administration → System → Settings → Profiler | show profiler statistics | Probe CPU < 10% load; no backlog |
| Posture/Compliance | Check posture load and posture logs | Operations → Reports → Posture → Posture Summary | tail -f /var/log/ise-posture.log | Posture checks completing in < 5s avg |
| PxGrid Services | Validate pxGrid stability | Administration → pxGrid Services → Clients | show application status ise show pxgrid connections | PxGrid stable, no drops, connected clients visible |
| Logging/Alarms | Check logging policy & purge | Administration → System → Logging → Purge Policy | ls -lh /opt/ise/logs/ | Logs rotating properly; no FS over-utilization |
| Replication (Cluster) | Validate replication between nodes | Administration → System → Deployment → Replication Status | show replication status | Replication state = “SUCCESS”; sync < 5s delay |
FAQs – Cisco ISE Performance Tuning
Q1. How can I quickly check if my ISE node is overloaded?
Answer:
- GUI:
- Navigate to:
Administration → System → Deployment → Node Status. - Look at CPU, memory, and disk utilization indicators.
- Navigate to:
- CLI:
show cpu usage show memory statistics show disk - Validation: CPU < 70% sustained, Memory < 75%, Disk ≥ 20% free.
If any threshold is breached, plan scaling or tune policies.
Q2. What are the main ISE logs to monitor for performance bottlenecks?
Answer:
- RADIUS Authentication:
/var/log/radius.log - Posture:
/var/log/ise-posture.log - Database:
/var/log/postgres/ - System Core:
/var/log/messages - Use:
tail -f /var/log/radius.log tail -f /var/log/ise-posture.log - GUI path:
Operations → Reports → Authentication → Live Logs.
Q3. How do I tune ISE for large-scale authentications (e.g., 50k users)?
Answer:
- Use dedicated Policy Service Nodes (PSNs) for authentications.
- Enable Load Balancers in front of PSNs.
- Validate via:
- GUI:
Operations → Reports → Active Sessions - CLI:
show session counts show logging application ise-psc.log
- GUI:
Q4. How do I check if replication between nodes is healthy?
Answer:
- GUI:
Administration → System → Deployment → Replication Status. - CLI:
show replication status - Healthy state should be SUCCESS with sync delay < 5 seconds.
If “FAILED” → restart replication service or check NTP sync.
Q5. My ISE authentication latency is high (>500ms). How do I troubleshoot?
Answer:
- Check PSN CPU/memory load (see Q1).
- Verify RADIUS logs for timeouts.
grep "Response-Time" /var/log/radius.log - Ensure network latency < 20ms between NADs and PSN.
- If DB lagging → check replication status and database statistics.
Q6. What are the best practices for ISE log storage tuning?
Answer:
- Set purge policies:
- GUI:
Administration → System → Logging → Purge Policy.
- GUI:
- CLI check disk usage:
show disk - Always maintain ≥ 20% free space.
- For heavy deployments → forward logs to an external Syslog/Splunk server.
Q7. How do I tune profiling so it doesn’t overload ISE?
Answer:
- GUI:
Administration → System → Settings → Profiler. - Disable unnecessary probes (e.g., NetFlow if unused).
- CLI:
show profiler statistics - Keep probe CPU utilization < 10%.
If higher, consider a dedicated Profiling Node.
Q8. How can I validate pxGrid service stability?
Answer:
- GUI:
Administration → pxGrid Services → Clients. - CLI:
show application status ise show pxgrid connections - Clients should appear “Connected”.
- If disconnects occur → check firewall ports (8910/8911) and system certificates.
Q9. What database tuning is possible in ISE?
Answer:
- ISE uses Postgres; tuning is limited but you can:
- Monitor DB health:
show application status ise - GUI:
Operations → Reports → System → ISE Database Status.
- Monitor DB health:
- If DB is overloaded → add more PSNs or reduce logging verbosity.
- Avoid manually tuning Postgres (unsupported by TAC).
Q10. How do I plan scaling ISE for performance?
Answer:
- Cisco recommends:
- Small: 2 nodes (Admin + PSN combined).
- Medium: 4–6 nodes (Dedicated Admin/PSN/Monitoring).
- Large Enterprise: 10+ nodes with Load Balancing.
- CLI for session tracking:
show session counts - GUI for monitoring:
Operations → Reports → Active Sessions. - Always follow the Cisco ISE Performance & Scale guide for version-specific numbers.
YouTube Link
For more in-depth Cisco ISE Mastery Training, subscribe to my YouTube channel Network Journey and join my instructor-led classes for hands-on, real-world ISE experience
Closing Notes
Performance tuning = discipline + measurement. Start with baseline, apply one change at a time, and validate: Live Logs latency, PSN health, NAD statistics, and replication. Keep policies lean, purge MnT, right-size timers, and balance PSN load.
Upgrade Your Skills – Start Today
For more in-depth Cisco ISE Mastery Training, subscribe to my YouTube channel Network Journey and join my instructor-led classes.
Fast-Track to Cisco ISE Mastery Pro
- I run a focused 4-month instructor-led CCIE Security track with live ISE labs focused on scaling + performance (policy optimization, PSN/LB tuning, MnT purge strategy, AD/site design, posture load control).
- Course outline & enrollment: https://course.networkjourney.com/ccie-security/
- Next step: Fill the intake form → free readiness call + performance lab checklist → secure your seat.
Enroll Now & Future‑Proof Your Career
Email: info@networkjourney.com
WhatsApp / Call: +91 97395 21088