Trainer Sagar Dhawan
- Posted on
[Day 146] Cisco ISE Mastery Training: Performance Benchmarking at Scale
Table of Contents
Introduction
Performance is at the heart of a robust Identity Services Engine (ISE) deployment. As organizations scale, ensuring that ISE can handle thousands of authentication requests per second, complex policy evaluations, and high endpoint diversity becomes critical. Performance Benchmarking at Scale allows network engineers to validate ISE node capacity, system health, authentication throughput, and latency under realistic workloads.
In this Article, you’ll learn how to benchmark ISE in a controlled lab, monitor system performance using both GUI and CLI tools, and identify potential bottlenecks before they impact production. This is crucial for enterprises managing hundreds of switches, wireless controllers, and thousands of endpoints, ensuring seamless NAC enforcement without downtime.
Performance benchmarking also forms the foundation for capacity planning, failover testing, and optimization of policy configurations for large-scale environments.
Problem Statement
Scaling ISE deployments introduces several real-world challenges:
- Authentication Latency: Slow response times during peak authentication events can degrade user experience.
- Node Overload: PSN or PAN nodes can reach maximum CPU, memory, or session limits if not properly sized.
- Policy Complexity: Multi-condition policies with profiling and posture checks can increase processing overhead.
- Failure Readiness: Without benchmarking, organizations cannot validate failover mechanisms.
- Network Growth: As endpoints and wireless clients increase, misjudged sizing can lead to authentication failures and network disruptions.
Impact: Poor performance can result in delayed access, security policy violations, and poor end-user experience—critical risks in enterprise networks.
Solution Overview
Cisco ISE provides:
- Node and System Monitoring: CPU, memory, disk I/O, session counts via GUI and CLI.
- Profiler and TACACS+ Optimization: Optimized endpoint profiling reduces system load.
- Performance Reports: Built-in reporting tools for authentication throughput, policy evaluation, and peak usage analysis.
- High Availability Validation: Supports lab benchmarking of failover and load-balancing mechanisms.
- CLI Benchmark Tools: Tools to simulate requests, analyze session counts, and validate system health.
By combining these capabilities, engineers can simulate high-load scenarios, analyze bottlenecks, and optimize the network access control architecture for scale, reliability, and speed.
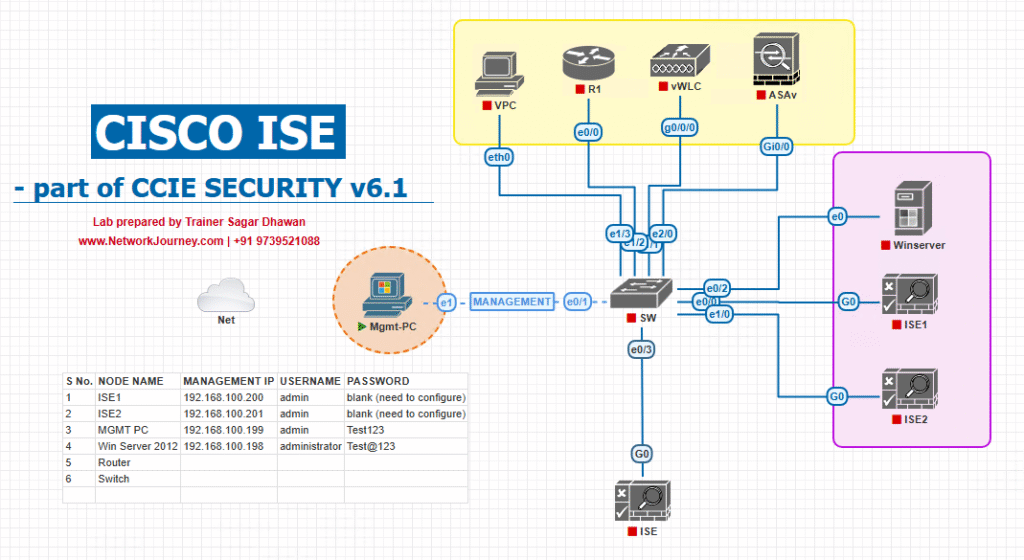
Sample Lab Topology
Lab Environment: VMware or EVE-NG
Topology Components:
- Cisco ISE Nodes: Primary Admin (PAN), Secondary PAN, 2x PSNs
- Core Switches: Cisco Catalyst 9300/9400
- Access Switches: Cisco Catalyst 9200
- Wireless Controllers: Cisco 9800 WLC
- Endpoints: Multiple virtual clients (Windows/Linux/iOS/Android)
- Load Simulation Tools: Ixia, Spirent, or simple Linux VMs with RADIUS testing scripts
Diagram :
Notes:
- VMware: Run ISE nodes as VM appliances
- EVE-NG: Use virtual switches + endpoints for authentication simulation
- Endpoints: Use automation tools to simulate simultaneous authentication
Step-by-Step GUI Configuration Guide
Objective: Benchmark ISE performance under realistic, high-load conditions.
Step 1: Log into ISE GUI
- URL:
https://<ISE-PAN-IP>:9060/ - Credentials: Admin (SuperAdmin)
- Verify node health: Administration → System → Deployment
- Validation: Node status =
UP
[Screenshot: ISE Deployment Status]
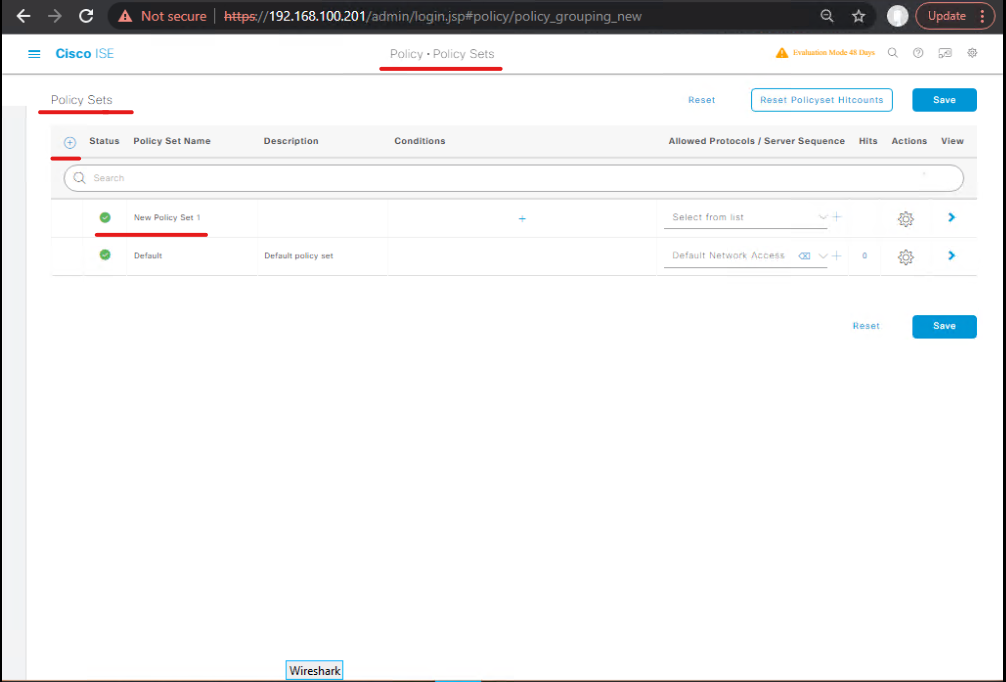
Step 2: Configure Authentication Policy for Load Testing
- Navigate: Policy → Policy Sets
- Create a dedicated Performance Test Policy Set
- Conditions:
- Network Device: Test Switch
- Identity Source: Internal Users or Test Endpoint Group
- Authentication: 802.1X or MAB
- Authorization: Default Full Access profile
[Screenshot: Policy Set for Load Test]
Step 3: Endpoint Simulation Preparation
- Use virtual endpoints in VMware/EVE-NG
- Assign MAC addresses or IP pools
- Tools:
- Linux VMs:
radtestoreapol_test - Windows: Multiple VM instances using PowerShell scripts
- Linux VMs:
- CLI Command for test:
radtest user1 password1 <ISE-PAN-IP> 1812 testing123
Step 4: Start Load Simulation
- Method 1: Concurrent RADIUS authentication requests
- Method 2: Posture compliance + profiling simulation
- Monitor sessions in GUI: Operations → RADIUS → Live Auth Sessions
- CLI validation:
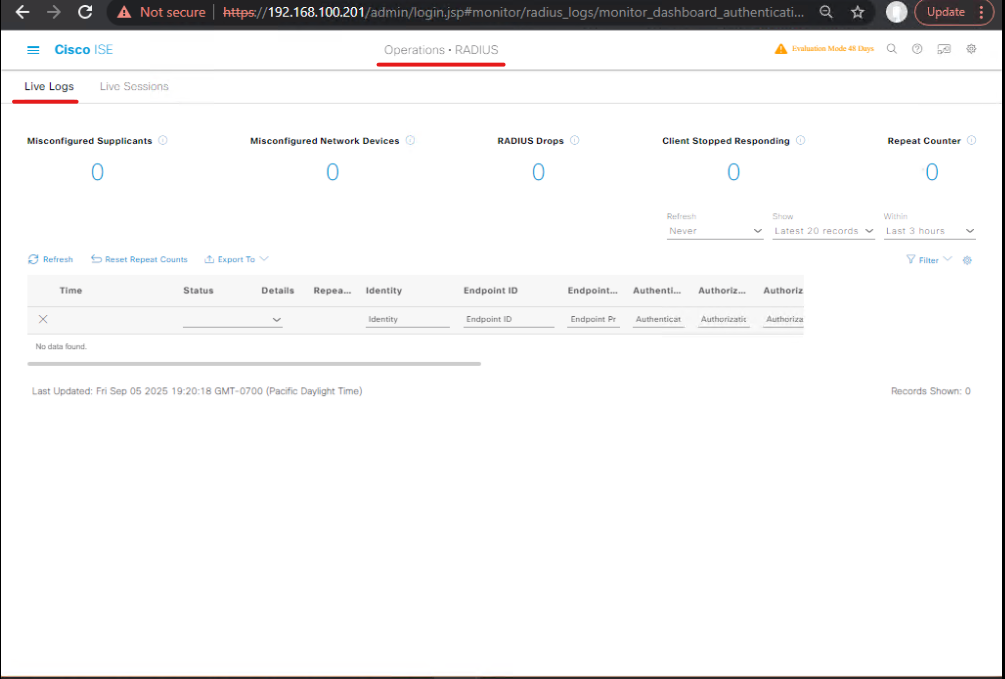
show authentication sessions
show radius statistics
show application status ise
Validation: Session count matches simulated endpoints; CPU/memory remains <80%.
Step 5: Monitor CPU/Memory/Disk Utilization
- Navigate: Administration → System → Monitoring → System Statistics
- Key Metrics:
- CPU utilization per node
- Memory utilization
- Disk I/O
- Active sessions per PSN
CLI Commands:
show application status ise
show system resources
[Screenshot: System Statistics Dashboard]
Step 6: Run Policy Evaluation Benchmark
- Navigate: Operations → Policy → Policy Troubleshooter
- Pick random endpoints
- Validate authentication and authorization flow
- CLI commands:
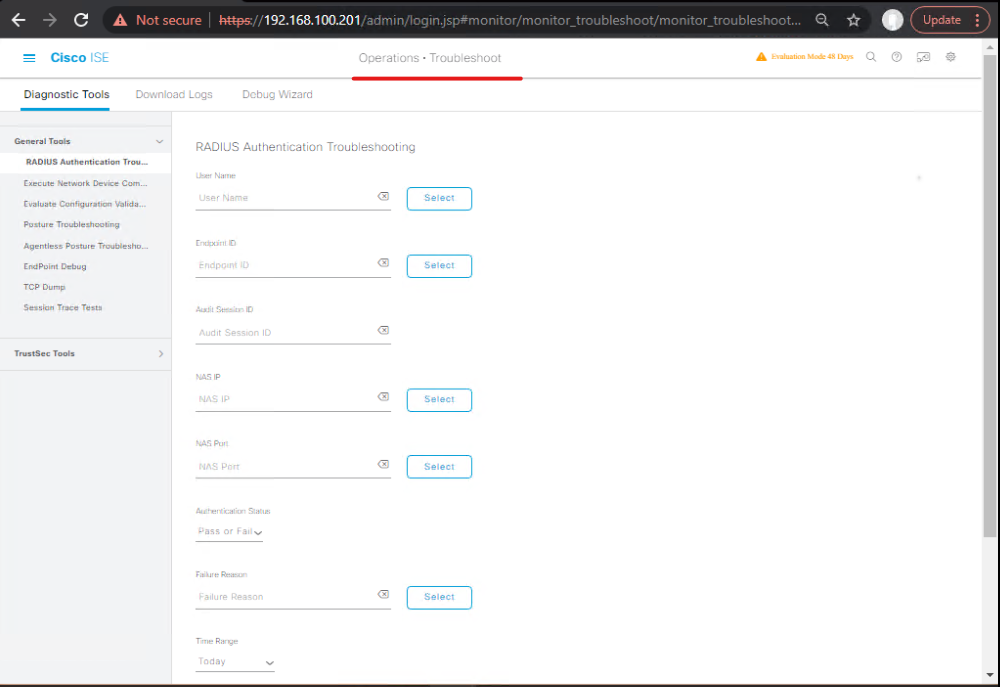
debug radius all
show authentication sessions details
Validation: No failed authentications, policy rules triggered as expected
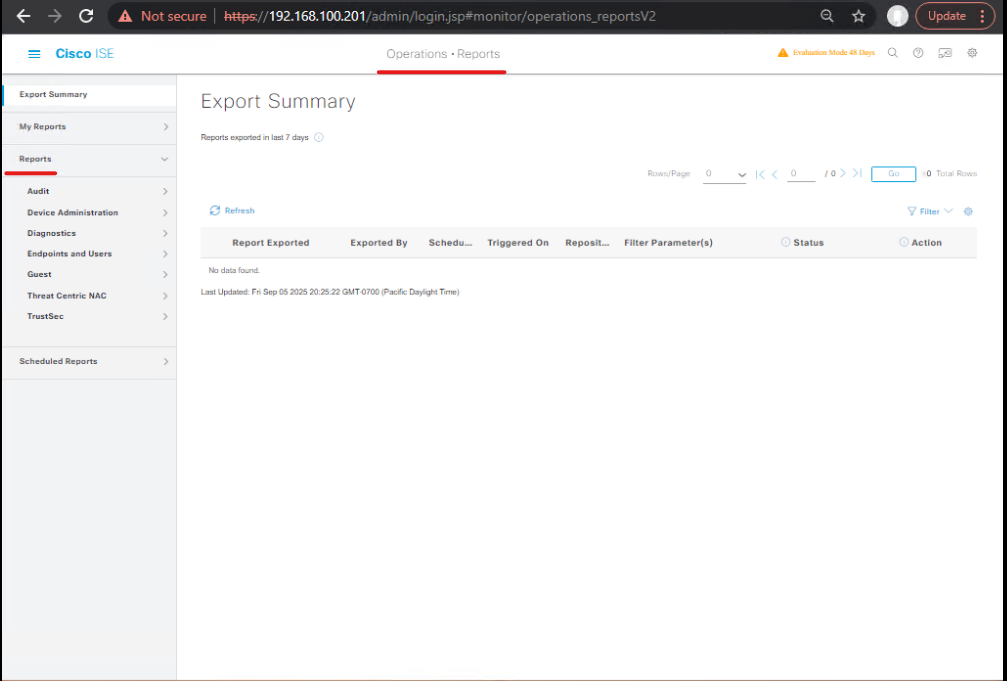
Step 7: Generate Performance Reports
- Operations → Reports → Predefined → Authentication Success/Failure
- Operations → Reports → Custom → Session per PSN, CPU vs. Load
- Export CSV/PDF
[Screenshot: Performance Report]
Step 8: Test Failover & High Availability
- Temporarily disable PSN node via GUI or CLI
- Observe load distribution across remaining PSNs
- CLI:
show application status ise
show running-config ise
Validation: Authentication throughput remains steady; sessions failover smoothly
Step 9: Optimize System
- Profile caching
- Reduce unnecessary profiling policies
- Use high-performance authorization rules
- CLI:
show profiler cache
clear profiler cache
[Screenshot: Profiler Optimization]
Troubleshooting & Diagnostics
Common Issues:
- PSN CPU spikes above 90%
- Authentication failures under load
- Session latency > 2 seconds
Diagnostics Steps:
- GUI:
- Operations → System Logs → Application Events
- Operations → Live Authentication
- CLI:
show application status ise
show authentication sessions details
debug radius all
show profiler cache
- Analyze reports for:
- Policy evaluation latency
- Top endpoints by session count
- Node resource usage
Solution Techniques:
- Adjust load-balancing settings
- Optimize profiling policies
- Verify hardware specs and VM resources
- Schedule benchmarking off-peak
Lab Walkthroughs with Validation
Scenario 1: High-Load Authentication Burst
- Simulate 500 concurrent endpoints
- Validate authentication success, CPU < 80%
- Monitor live sessions
- Generate performance report
Scenario 2: PSN Failover Test
- Disable PSN1
- Validate remaining PSN handles session load
- Check logs for failed attempts
- Restore PSN1 and validate session rebalancing
Expert-Level Use Cases
- Multi-PSN Load Distribution Validation
- Map endpoints across PSNs
- CLI validation:
show application status ise - Validate equal distribution
- Profiler Stress Test
- Enable profiling for all endpoint types
- Run high-load tests
- Monitor cache hits/misses
- Validate latency
- Large-Scale Policy Set Evaluation
- Deploy complex multi-condition rules
- Simulate authentication requests
- Validate which rules are triggered most
- Adjust for performance
- Automated Benchmarking Scripts
- Use Linux/Python to trigger RADIUS requests
- Monitor results in GUI + CLI
- Generate weekly performance baseline
FAQs
1. How many concurrent endpoints can a single PSN node realistically handle?
- Depends on hardware or VM sizing, configured policies, profiling, and posture checks.
- Typical guidance: 10,000–20,000 sessions per high-performance PSN node.
- CLI check:
show application status ise
show authentication sessions
2. How do I monitor CPU and memory usage during peak authentication events?
- GUI: Administration → System → Monitoring → System Statistics
- CLI:
show system resources
show application status ise
- Monitor trends to avoid node overload (>80% CPU/memory utilization).
3. What’s the best practice for benchmarking ISE in VMware vs. EVE-NG?
- VMware: Use full VM appliances with adequate CPU/RAM, better for realistic load.
- EVE-NG: Great for multi-node lab simulation, but performance limited by host resources.
- Always simulate expected production load for accurate results.
4. How can I simulate wireless authentication at scale?
- Use WLC + virtual clients or automated scripts (Linux/Python/PowerShell).
- Simulate 802.1X or MAB requests concurrently.
- Monitor sessions in Operations → RADIUS → Live Auth Sessions.
5. How to validate policy evaluation latency under high load?
- Use Policy Troubleshooter for selected endpoints during peak load.
- CLI:
debug radius all
show authentication sessions details
- Measure response times and compare with SLA requirements (<2 sec typical).
6. Can ISE handle profiling and posture evaluation simultaneously at scale?
- Yes, but this increases CPU/memory utilization.
- Best practice: Optimize profiling rules, cache common endpoints, and schedule posture scans carefully.
- CLI:
show profiler cache
show profiler statistics
7. How to test PSN failover during high-load scenarios?
- Temporarily disable one PSN node in GUI or CLI.
- Monitor remaining PSNs for authentication throughput, session redistribution, and latency.
- CLI validation:
show application status ise
show authentication sessions
8. How to automate performance benchmarking scripts for daily testing?
- Use Linux VMs with
radtestoreapol_testto simulate authentication bursts. - Automate with Bash/Python scripts to generate reports.
- Pull metrics via CLI (
show radius statistics,show authentication sessions) or API for historical analysis.
9. What CLI commands provide real-time authentication statistics?
show authentication sessions
show authentication sessions details
show radius statistics
debug radius all
show application status ise
- Combine with GUI monitoring for comprehensive insights.
10. How to interpret session distribution and optimize load balancing?
- GUI: Administration → System → Deployment → Node Status → Session Count
- CLI:
show application status ise - Check for uneven session distribution; adjust node affinity or load-balancing policies.
- Goal: Even distribution across PSNs to prevent bottlenecks.
YouTube Link
For more in-depth Cisco ISE Mastery Training, subscribe to my YouTube channel Network Journey and join my instructor-led classes for hands-on, real-world ISE experience
Closing Notes
- Performance benchmarking is essential before production scale deployment.
- GUI + CLI validation ensures real-time insights and accurate capacity planning.
- Regular benchmarking prevents authentication bottlenecks and improves end-user experience.
- High availability testing validates failover readiness.
- Always optimize policies, profiling, and cache for large-scale performance.
Upgrade Your Skills – Start Today
For more in-depth Cisco ISE Mastery Training, subscribe to my YouTube channel Network Journey and join my instructor-led classes. Learn from hands-on labs, real-world scenarios, and expert insights that take you from basic configuration to enterprise-level scale validation.
Fast-Track to Cisco ISE Mastery Pro
Join my 4-month instructor-led CCIE Security-focused training:
- Hands-On Labs: VMware/EVE-NG, PSN/PAN scale testing, policy optimization
- Expert Mentorship: Troubleshooting, failover, and profiling at scale
- Exam-Oriented Guidance: High-scale deployments and real-world simulations
- Certificate of Completion: Industry-recognized validation of skill
- Register today at networkjourney.com/ccie-security
Don’t just configure ISE; master its performance under enterprise-scale pressure.
Enroll Now & Future‑Proof Your Career
Email: info@networkjourney.com
WhatsApp / Call: +91 97395 21088