![[Day #22 PyATS Series] Interface Status Check Across Vendors Using pyATS for Cisco](https://networkjourney.com/wp-content/uploads/2025/07/Day22-PyATS-Series-Interface-Status-Check-Across-Vendors-Using-pyATS-for-Cisco.png)
Trainer Sagar Dhawan
- Posted on
[Day #22 PyATS Series] Interface Status Check Across Vendors Using pyATS for Cisco [Python for Network Engineer]
Table of Contents
Introduction
In every production network, ensuring interface health and status consistency across devices is crucial. A single downed port can lead to outages, suboptimal routing, or even compliance issues. Traditionally, engineers log into each device to verify interface states, which is error-prone and time-consuming. With pyATS, Cisco’s automation framework, we can automate interface status checks across multiple vendors, including Cisco, Arista, Palo Alto, and FortiGate.
This post is written for Python for Network Engineer learners looking to streamline operational tasks. By the end, you’ll have a reusable script to validate interface states across your entire network fabric in seconds. The same approach can scale from a few devices to hundreds.
Topology Overview
We’ll demonstrate with a simple topology:
- Router1 – Cisco ISR4431
- Switch1 – Cisco Catalyst 9300
- Firewall1 – Palo Alto PA-3220
- Switch2 – Arista EOS
- Fortigate1 – FortiGate 100F
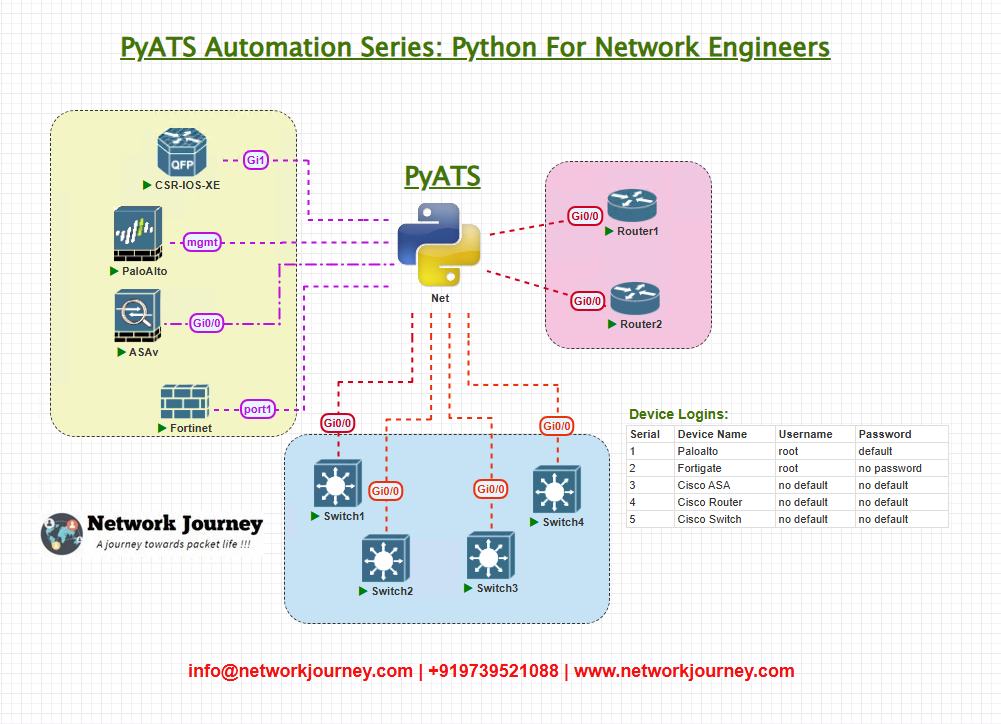
Our goal is to connect to all these devices and report interface states (up/down, admin/operational status, speed, duplex).
Topology & Communications
- Communication Protocol: SSH (multi-vendor supported)
- Authentication: Username/password from testbed.yml
- pyATS Libraries: Genie for structured output parsing
The script will:
- Connect to each device in testbed
- Run platform-specific
show interfaces statusor equivalent commands - Normalize results in a common format
- Report down or administratively disabled interfaces
This ensures consistent visibility across different vendors.
Workflow Script
from genie.testbed import load
import json

def capture_interfaces(device):
    device.connect(log_stdout=False)
    if device.os == 'iosxe':
        output = device.parse('show interfaces status')
    elif device.os == 'eos':
        output = device.parse('show interfaces status')
    elif device.os == 'panos':
        output = device.parse('show interface all')
    elif device.os == 'fortinet':
        output = device.parse('get system interface')
    else:
        output = {}
    device.disconnect()
    return output

def summarize(output):
    summary = {}
    for intf, details in output.get('interfaces', {}).items():
        admin_state = details.get('admin_state', 'unknown')
        oper_state = details.get('oper_state', 'unknown')
        summary[intf] = {'admin': admin_state, 'oper': oper_state}
    return summary

if __name__ == "__main__":
    testbed = load('testbed.yml')
    devices = testbed.devices
    status_report = {}

    for name, device in devices.items():
        print(f"Checking interfaces on {name}...")
        intf_output = capture_interfaces(device)
        status_report[name] = summarize(intf_output)

    with open('interface_status_report.json', 'w') as f:
        json.dump(status_report, f, indent=4)

    print(json.dumps(status_report, indent=4))
Explanation by Line
- Import modules: pyATS testbed loader and JSON for report generation.
- capture_interfaces(): Handles vendor-specific parsing:
- Cisco IOS-XE and Arista EOS →
show interfaces status - Palo Alto PAN-OS →
show interface all - Fortinet →
get system interface
- Cisco IOS-XE and Arista EOS →
- summarize(): Normalizes the parsed output into a common format.
- Main execution: Iterates through all devices, collects status, and outputs a consolidated JSON report.
This enables you to see down interfaces across multiple vendors in one unified view.
testbed.yml Example
testbed:
  name: interface_status
  devices:
    Router1:
      os: iosxe
      type: router
      connections:
        cli:
          protocol: ssh
          ip: 192.168.1.1
      credentials:
        default:
          username: admin
          password: cisco123

    Switch1:
      os: iosxe
      type: switch
      connections:
        cli:
          protocol: ssh
          ip: 192.168.1.2
      credentials:
        default:
          username: admin
          password: cisco123

    Firewall1:
      os: panos
      type: firewall
      connections:
        cli:
          protocol: ssh
          ip: 192.168.1.3
      credentials:
        default:
          username: admin
          password: paloalto123

    Switch2:
      os: eos
      type: switch
      connections:
        cli:
          protocol: ssh
          ip: 192.168.1.4
      credentials:
        default:
          username: admin
          password: arista123

    Fortigate1:
      os: fortinet
      type: firewall
      connections:
        cli:
          protocol: ssh
          ip: 192.168.1.5
      credentials:
        default:
          username: admin
          password: fortinet123
Post-validation CLI Screenshots (Expected Output)
Cisco IOS-XE:
Switch1# show interfaces status
Gi1/0/1 connected 1G full a-100 10/100/1000BaseTX
Gi1/0/2 notconnect auto auto 10/100/1000BaseTX
Arista EOS:
Switch2# show interfaces status
Eth1 connected 1G full a-100
Eth2 disabled auto auto
Palo Alto:
> show interface all
ethernet1/1 up up 1000
ethernet1/2 down down 1000
Script Output:
{
    "Router1": {"Gi0/0": {"admin": "up", "oper": "up"}},
    "Switch1": {"Gi1/0/2": {"admin": "up", "oper": "down"}},
    "Firewall1": {"ethernet1/2": {"admin": "up", "oper": "down"}},
    "Switch2": {"Eth2": {"admin": "down", "oper": "down"}},
    "Fortigate1": {"port2": {"admin": "up", "oper": "down"}}
}
FAQs
1. How does this script handle different OS-specific interface naming conventions?
pyATS parses each vendor’s native command output and normalizes the data into a Python dictionary. You can include translation logic to standardize names across Cisco, Arista, Palo Alto, and Fortinet.
2. Can the script detect administratively shut interfaces versus operationally down interfaces?
Yes. The admin_state and oper_state fields distinguish between a disabled port (admin down) and a link failure (oper down). This helps troubleshoot configuration versus physical issues.
3. What if a parser is not available for a particular device OS or version?
You can write a custom Genie parser or use raw CLI outputs with regex. pyATS allows plugin extensions for unsupported devices.
4. How can this be integrated into continuous monitoring?
Schedule the script with cron or Windows Task Scheduler to run periodically. You can also integrate it with monitoring platforms (e.g., Netbox, Nagios) via APIs or webhook alerts.
5. Does the script support high availability clusters (e.g., dual supervisors)?
Yes. Add both HA members to testbed.yml, and the script will collect interface data from each supervisor, ensuring redundancy checks.
6. How scalable is this solution for large networks?
pyATS can handle hundreds of simultaneous device sessions. Use connection pools or distributed runs for networks with thousands of interfaces.
7. Can I visualize the interface report on a dashboard?
Absolutely. Export the JSON output to Grafana, Kibana, or a custom Flask/Django web dashboard for real-time visualization.
8. Is it possible to run compliance checks (e.g., ensuring all uplinks are enabled)?
Yes. You can extend the script to include logic that flags interfaces not meeting predefined compliance policies (uplinks down, ports mismatched).You can run the script multiple times or add logic to check operational status over multiple samples to detect flapping.
YouTube Link
Watch the Complete Python for Network Engineer: Interface Status Check Across Vendors Using pyATS for Cisco [Python for Network Engineer] Lab Demo & Explanation on our channel:
Join Our Training
Understanding multi-vendor interface health is a must-have skill for modern network engineers. Trainer Sagar Dhawan offers a 3-month instructor-led training covering Python, Ansible, APIs, and Cisco DevNet for Network Engineers. This course equips you with the ability to automate operational checks like interface status validation and more.
Join the Training Here to future-proof your career and gain expert-level Python for Network Engineer skills.
Enroll Now & Future‑Proof Your Career
Email: info@networkjourney.com
WhatsApp / Call: +91 97395 21088
![[Day #50 PyATS Series] Automated Configuration Backup (Multi-Vendor) Using pyATS for Cisco [Python for Network Engineer]](https://networkjourney.com/wp-content/uploads/2025/08/Day-50-PyATS-Series-Automated-Configuration-Backup-Multi-Vendor-Using-pyATS-for-Cisco.png)
![[Day #96 PyATS Series] Automate License Compliance Checks (Cisco Smart Licenses) Using pyATS for Cisco [Python for Network Engineer]](https://networkjourney.com/wp-content/uploads/2025/09/Day-96-PyATS-Series-Automate-License-Compliance-Checks-Cisco-Smart-Licenses-Using-pyATS-for-Cisco-Python-for-Network-Engineer-470x274.png)
![Version Control for Network Configs – Bring Git-Like Power to Your Routers! [CCNP ENTERPRISE]_networkjourney](https://networkjourney.com/wp-content/uploads/2025/07/Version-Control-for-Network-Configs-–-Bring-Git-Like-Power-to-Your-Routers-1.png)