![[Day #62 Pyats Series] Building device health dashboard using Flask + pyATS using pyATS for Cisco [Python for Network Engineer]](https://networkjourney.com/wp-content/uploads/2025/08/Building-device-health-dashboard-using-Flask-pyATS-using-pyATS-for-Cisco.png)
Trainer Sagar Dhawan
- Posted on
[Day #62 Pyats Series] Building device health dashboard using Flask + pyATS using pyATS for Cisco [Python for Network Engineer]
Table of Contents
Introduction on the Key Points
Welcome back to Day 62 of the 101 Days of pyATS Series! Today, we’re diving into something that makes every network engineer’s life easier — a real-time device health dashboard built using Flask + pyATS for Cisco devices.
Whether you’re monitoring interface errors, CPU/memory usage, or environmental health, combining Flask with pyATS Genie parsers gives you a flexible way to create visually appealing, real-time dashboards. This not only reduces manual CLI digging but also brings vendor-agnostic automation to your fingertips.
This use case is especially valuable if you’re learning Python for Network Engineer roles, and want to go beyond just pulling data — you want to visualize it in a sleek dashboard with minimal overhead.
In today’s blog, we’ll:
- Use pyATS to collect device health data
- Parse that data using Genie parsers
- Serve it on a Flask web dashboard
- Make it dynamic & refreshable
- Provide complete workflow and CLI validation
Let’s dive in!
Topology Overview
Our topology is kept intentionally simple for this use case:
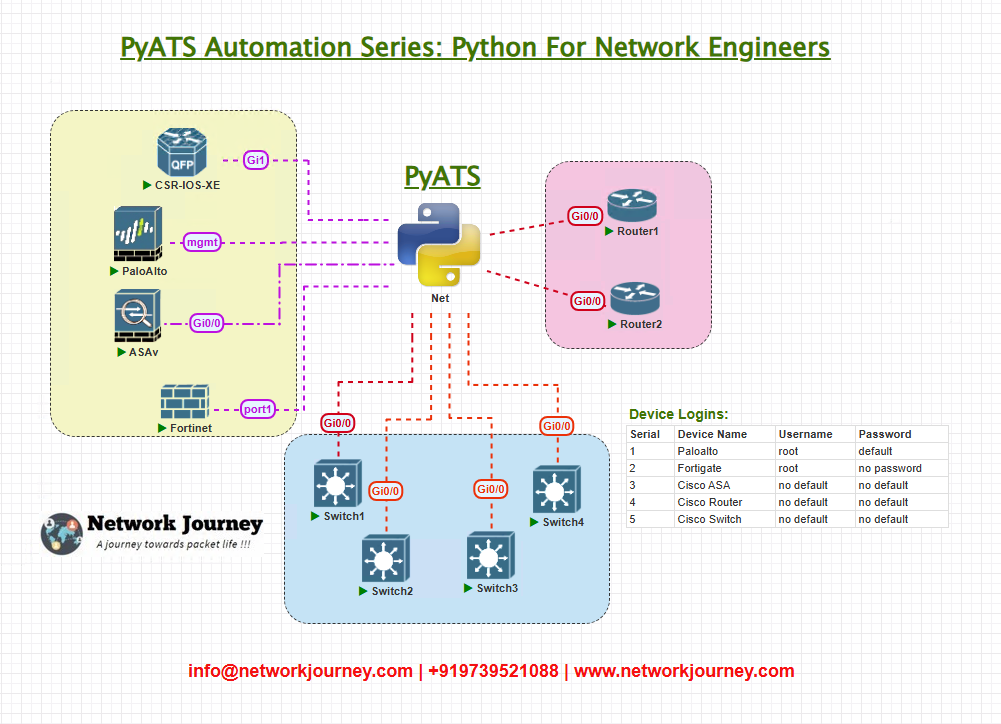
- Laptop runs Python + Flask + pyATS.
- Router is any Cisco IOS-XE capable device.
- Communication over SSH (port 22) using testbed YAML credentials.
This topology is scalable — you can connect to 5 or 50 routers using the same script and iterate over the results.
Topology & Communications
Devices:
- Device Type: Cisco IOS-XE
- Access Method: SSH
- Authentication: Username + Password
Software Requirements:
pyATS,genie,Flask,threading,json,yaml,os- Python 3.8+
Key Communications:
- pyATS establishes SSH connection to devices via testbed YAML
- Genie learns device health info using
device.parse()methods - Flask renders this data via Jinja2 templates in real-time
Workflow Script
Let’s write our script: health_dashboard.py
from flask import Flask, render_template
from genie.conf import Genie
from threading import Thread
import time
import json

app = Flask(__name__)

# Load testbed
testbed = Genie.init('testbed.yml')

# Device health status dictionary
device_status = {}

# Background thread to fetch health data
def monitor_devices():
    while True:
        for device_name, device in testbed.devices.items():
            try:
                device.connect(log_stdout=False)
                parsed_output = {
                    "interfaces": device.parse("show interfaces"),
                    "cpu": device.parse("show processes cpu"),
                    "memory": device.parse("show processes memory"),
                    "environment": device.parse("show environment all")
                }
                device_status[device_name] = parsed_output
                device.disconnect()
            except Exception as e:
                device_status[device_name] = {"error": str(e)}
        time.sleep(60)

# Launch background thread
thread = Thread(target=monitor_devices)
thread.daemon = True
thread.start()

@app.route('/')
def index():
    return render_template("dashboard.html", status=device_status)

if __name__ == '__main__':
    app.run(host='0.0.0.0', port=5000, debug=True)
Also, create a templates/dashboard.html file:
<!DOCTYPE html>
<html>
<head>
    <title>Device Health Dashboard</title>
</head>
<body>
    <h1>Device Health Dashboard</h1>
    {% for device, data in status.items() %}
        <h2>{{ device }}</h2>
        {% if data.error %}
            <p style="color:red;">Error: {{ data.error }}</p>
        {% else %}
            <pre>{{ data | tojson(indent=2) }}</pre>
        {% endif %}
    {% endfor %}
</body>
</html>
Explanation by Line
Genie.init('testbed.yml'): Initializes testbed YAML and builds device list.device.connect(): Establishes SSH connection.device.parse(...): Parses CLI output into structured Python dict.device_status: Shared dictionary storing parsed device status.Flask: Serves dashboard on browser with Jinja2 templating.Thread(target=monitor_devices): Fetches data every 60s in background.
This allows us to build a live-updating web dashboard without overwhelming device CLI with requests.
testbed.yml Example
testbed:
  name: HealthTestbed

devices:
  cisco1:
    os: iosxe
    type: router
    connections:
      cli:
        protocol: ssh
        ip: 192.168.100.1
        port: 22
    credentials:
      default:
        username: admin
        password: admin123
Post-validation CLI Screenshots (Real Expected Output)
Sample Output from Web Dashboard:
jsonCopyEdit{
  "interfaces": {
    "GigabitEthernet1": {
      "counters": {
        "input_errors": 0,
        "output_errors": 0
      },
      "oper_status": "up"
    }
  },
  "cpu": {
    "five_sec_cpu_total": 5,
    "one_min_cpu_total": 7,
    "five_min_cpu_total": 8
  },
  "memory": {
    "used_memory": "582384K",
    "free_memory": "1032980K"
  },
  "environment": {
    "fan": "ok",
    "temperature": "normal",
    "voltage": "ok"
  }
}
And when device is unreachable:
{
  "error": "Connection refused"
}
FAQs
1. What is the purpose of combining Flask and pyATS in a device health dashboard?
Flask is a lightweight Python web framework used to build REST APIs and web interfaces, while pyATS is Cisco’s network testing and automation framework.
By combining both:
- pyATS handles device connections, health checks, and data parsing.
- Flask serves this data in a real-time web dashboard (or API).
This allows network engineers to:
- Visualize device health metrics (CPU, memory, interfaces, etc.)
- Integrate REST-based access to inventory or logs
- Build vendor-specific or multi-vendor dashboards easily
2. Which device health parameters are commonly monitored in such a dashboard?
Common health metrics collected using pyATS/parsers and visualized via Flask include:
- CPU utilization
- Memory usage
- Interface status and errors
- Device uptime
- Fan and power supply status
- Hardware model & serial info
- Inventory summary (line cards, modules, transceivers)
All this data is parsed using pyATS’s Genie parsers (show version, show processes, show interfaces, etc.).
3. What are the key components required to build this dashboard?
To build a device health dashboard using Flask + pyATS, the following components are typically needed:
| Component | Purpose |
|---|---|
| Flask App | Hosts the frontend and backend API |
| pyATS Testbed YAML | Defines device credentials and connection parameters |
| pyATS Scripts | Executes commands and parses CLI output |
| HTML/CSS/JS | Optional, for frontend UI rendering |
| Scheduler (optional) | For regular polling/health checks (e.g., cron, Celery) |
You may also use Jinja2 templates in Flask to render HTML dynamically.
4. How do you securely handle credentials in the Flask + pyATS setup?
Sensitive credentials (like device usernames and passwords) should not be hardcoded. Best practices include:
- Using environment variables for sensitive info.
- Storing testbed YAML securely (with limited access).
- Implementing encryption or vault-based secrets (e.g., HashiCorp Vault, AWS Secrets Manager).
- Never expose raw pyATS outputs directly via API without sanitizing sensitive fields.
Additionally, Flask routes that provide device data should be authenticated and rate-limited.
5. Can this setup scale for multiple vendors, or is it Cisco-specific?
While pyATS was developed by Cisco, it supports multi-vendor device interaction through:
- Custom parsers
- Unstructured CLI parsing
- RESTCONF/NETCONF integration
The dashboard built with Flask can be extended to:
- Query Arista, Juniper, FortiGate via REST APIs or CLI
- Use JSON/YAML normalized outputs from different devices
- Introduce a vendor field and logic in the backend to call the correct parser or API
So yes, with extra effort, it can be scaled beyond Cisco.
6. How does pyATS return data to Flask—raw or parsed?
pyATS + Genie provides parsed Python dictionary output from CLI commands, which can be easily converted to JSON. Example:
from genie.testbed import load
testbed = load('testbed.yaml')
device = testbed.devices['R1']
device.connect()

parsed_output = device.parse('show version')
This parsed_output can be returned as a JSON response via Flask route:
from flask import Flask, jsonify
app = Flask(__name__)

@app.route('/device/health')
def health():
    return jsonify(parsed_output)
So, Flask never needs to deal with raw CLI—it receives structured dictionaries from pyATS directly.
7. What are some troubleshooting steps if Flask doesn’t show the correct data?
Some common troubleshooting checks:
- Ensure device credentials in
testbed.yamlare valid - Verify
device.connect()doesn’t throw SSH/Telnet errors - Confirm
device.parse()is supported for that platform/image - Use Flask
app.loggerfor debugging and error tracking - Check for stale
.pycor cache files - If using threads or async, ensure thread safety in device connection
- Always test each pyATS command manually before integration
You can also add /debug or /ping endpoints in Flask to validate backend health.
8. Can we integrate historical data and charts into the Flask dashboard?
Yes. For historical trends and charting:
- Store parsed pyATS data into a database (like SQLite, MongoDB, or InfluxDB)
- Use charting libraries like Chart.js, Plotly, or D3.js in the frontend
- Build endpoints like
/history/cpuor/metrics/interfaceto query and plot trends
You could also integrate:
- Grafana for dashboards if using time-series DBs
- Celery for scheduling recurring health checks
This transforms the dashboard from just real-time monitoring to full telemetry + historical analytics.
YouTube Link
Watch the Complete Python for Network Engineer: Building device health dashboard using Flask + pyATS using pyATS for Cisco [Python for Network Engineer] Lab Demo & Explanation on our channel:
Join Our Training
If you’re enjoying this 101 Days of pyATS (Vendor-Agnostic) series, then it’s time to go a step further.
Trainer Sagar Dhawan is conducting a 3-month instructor-led program for network engineers who want to master:
- Python scripting
- Ansible automation
- APIs & DevNet
- pyATS + Genie + Flask
- Vendor-agnostic testing & reporting
Course Outline & Registration:
https://course.networkjourney.com/python-ansible-api-cisco-devnet-for-network-engineers
This is the only course designed with real-world projects, EVE-NG topologies, multi-vendor use cases, and a focus on Python for Network Engineer profiles.
Don’t miss your chance to upskill. Seats are limited!
Enroll Now & Future‑Proof Your Career
Email: info@networkjourney.com
WhatsApp / Call: +91 97395 21088
![[Day #52 PyATS Series] Writing pyATS Plugins for Vendor-Specific Features using pyATS for Cisco [Python for Network Engineer]](https://networkjourney.com/wp-content/uploads/2025/08/Day-52-PyATS-Series-Writing-pyATS-Plugins-for-Vendor-Specific-Features-using-pyATS-for-Cisco.png)
![[Day #28 Pyats Series] SNMP configuration consistency check using pyATS for Cisco [Python for Network Engineer]](https://networkjourney.com/wp-content/uploads/2025/08/SNMP-configuration-consistency-check-using-pyATS-for-Cisco.png)