Trainer Sagar Dhawan
- Posted on
[Day 79] Cisco ISE Mastery Training: Context Visibility Dashboard
Table of Contents
Introduction
In the modern enterprise, visibility is not a “nice-to-have” — it’s the first line of defense. You can’t secure what you don’t know exists.
Cisco ISE’s Context Visibility Dashboard is your single pane of glass that consolidates endpoint identity, posture, profiling, authentication events, user sessions, and device compliance — in real time.
Think of it as the x-ray machine of your network. It not only shows what devices are connected but also who owns them, how they connected, where they connected, and what risk level they bring.
ISE Context Visibility directly impacts:
- Security Operations (SOC): Instant endpoint discovery & forensics.
- Network Engineers: Validate profiling & policy enforcement.
- Compliance Teams: Audit reports & endpoint categorization.
- TrustSec & pxGrid Integrations: Data feeds into Stealthwatch, Firepower, DNA-C, Splunk, etc.
Problem Statement
Without context visibility:
- You see only IP addresses in logs, not device types, OS, or ownership.
- Endpoint classification (printers, IoT, phones, laptops) is a blind spot.
- Helpdesk cannot troubleshoot who is on which switch port / AP / SSID.
- Security team cannot correlate NAC events with threat intelligence.
- Lack of profiling = bad policy enforcement (e.g., IoT device mis-classified as laptop).
Challenge: Networks are dynamic. IoT, BYOD, and mobile endpoints connect constantly. Without visibility, policy enforcement collapses.
Solution Overview
ISE Context Visibility solves this by:
- Collecting data from RADIUS accounting, DHCP, SNMP, NetFlow, HTTP probes, pxGrid.
- Categorizing endpoints by device type, OS, vendor, profile, posture, SGT.
- Allowing real-time filtering, grouping, and export of device data.
- Giving role-based visibility (helpdesk vs admin).
- Feeding data into TrustSec, Firepower, Stealthwatch, DNA-C via pxGrid.
It’s not just a dashboard — it’s a security intelligence fabric.
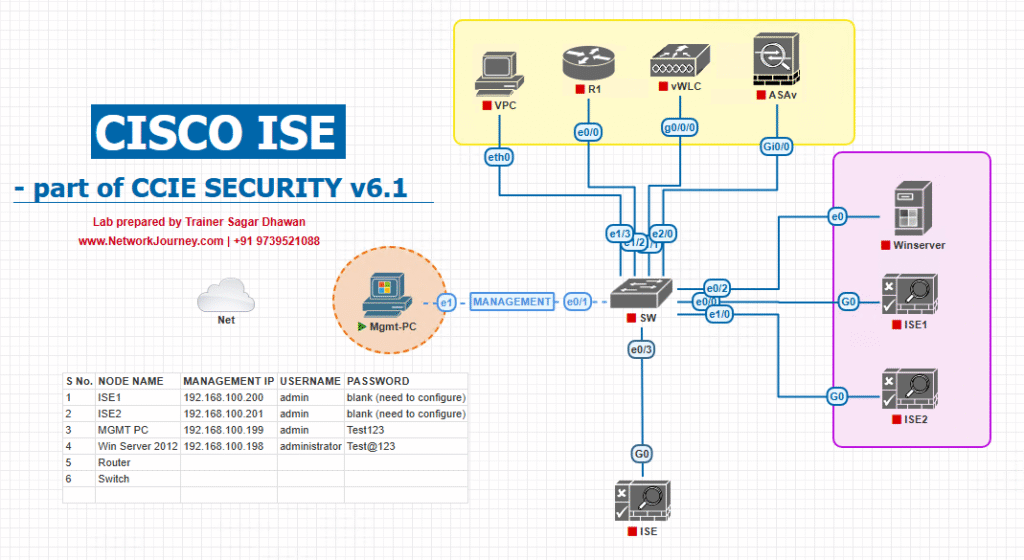
Sample Lab Topology
We’ll use EVE-NG Lab with VMware ISE nodes.
Lab Components:
- Cisco ISE: 2 nodes (Admin/Policy + PSN).
- Switch: Catalyst 9300 (TrustSec + 802.1X + SGT capable).
- WLC: 9800-CL in EVE-NG for wireless endpoints.
- Access Points: Simulated lightweight APs.
- Endpoints:
- Windows 10 laptop (corporate).
- iPhone (BYOD).
- HP Printer (IoT).
- Ubuntu Linux (contractor).
Diagram (textual):
Step-by-Step GUI Configuration Guide
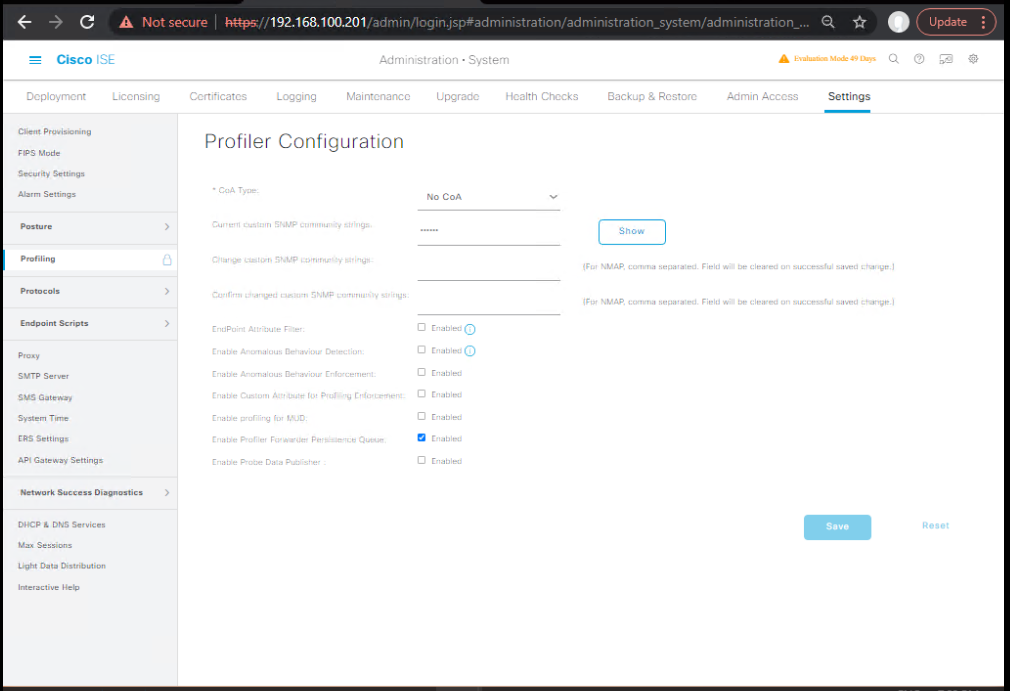
Step 1: Enable Probes
- Login to ISE Admin GUI.
- Navigate: Administration > System > Settings > Profiler.
- Enable required probes:
- DHCP, RADIUS, HTTP, SNMP, NetFlow, SPAN.
- [Screenshot: ISE Profiler Probes Settings]
CLI Validation:
ise/admin# show profiler status
ise/admin# show application status ise
Step 2: Access Context Visibility Dashboard
- Navigate: Context Visibility > Endpoints.
- Default view = all active sessions.
- [Screenshot: ISE Context Visibility Endpoints Dashboard]
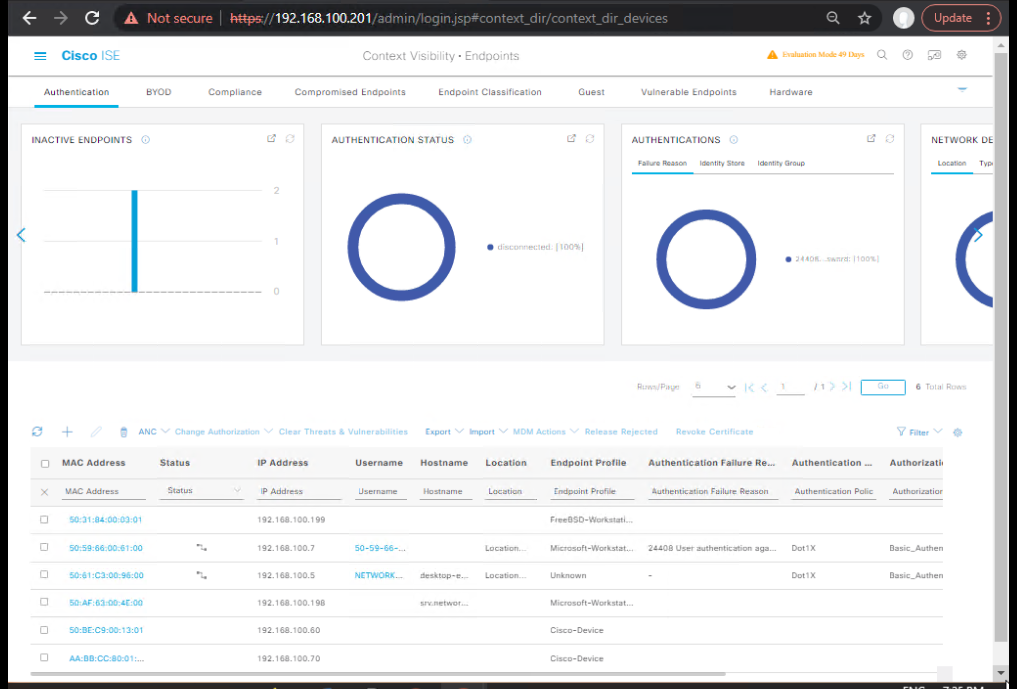
- Validate endpoints discovered via profiling (Windows, iPhone, Printer).
Step 3: Apply Filters & Grouping
- Use Filters: by SSID, IP, MAC, OS, SGT.
- Example: Filter → Device Type = Printer.
- [Screenshot: Filter View Applied]
- Group by Device Manufacturer.
- Helps identify IoT fleets.
Step 4: Drill into Endpoint Details
- Click on an endpoint → Session Details.
- Username, IP, MAC, Device Profile, Posture, Switch/Port, Security Group.
- [Screenshot: Endpoint Session Detail Page]
CLI Validation on switch:
show authentication sessions interface Gi1/0/3 details
show cts role-based sgt-map
Step 5: Use Context Visibility Sub-Tabs
- Endpoints Tab → All active endpoints.
- Users Tab → All authenticated users (from AD/LDAP).
- Applications Tab → Detected application usage (via NetFlow probe).
- SGT Tab → Mapping of endpoints to Security Groups.
- Posture Tab → Compliant vs Non-Compliant endpoints.
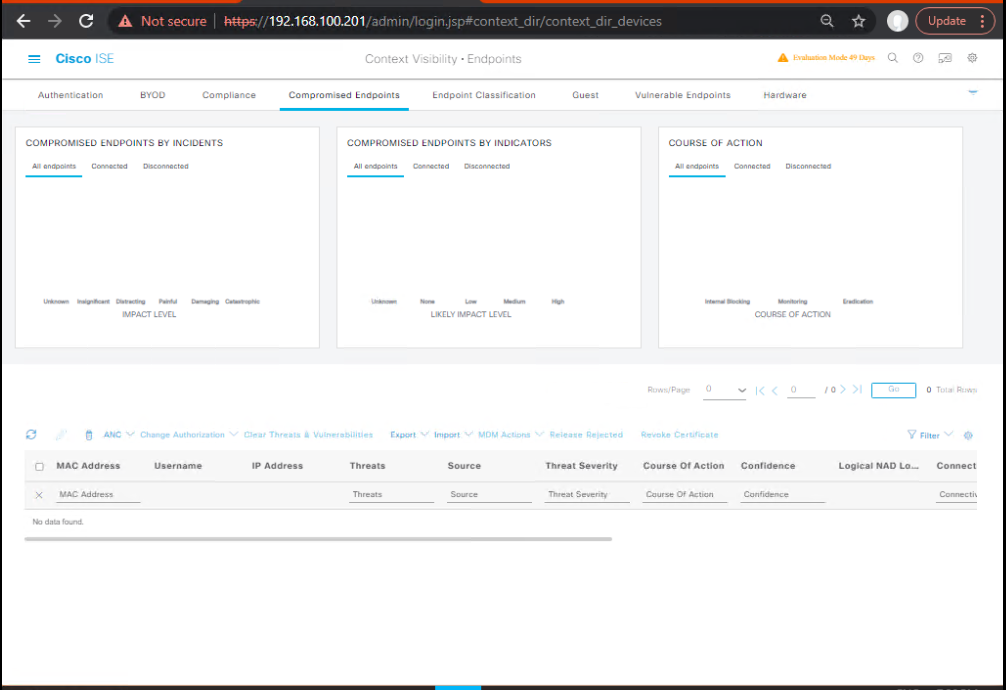
- Threat Tab → Events integrated from Firepower/AMP.
Step 6: Export Reports
- Click Export → CSV/PDF.
- Schedule periodic reports for compliance.
Step 7: Integration with pxGrid
- Navigate: Administration > pxGrid Services.
- Enable pxGrid for sharing Context Visibility with Firepower, Stealthwatch, DNA-C.
CLI Validation:
ise/admin# show running-config pxgrid
Step 8: Troubleshooting Context Visibility
- If endpoints missing → check RADIUS accounting on switch:
aaa accounting dot1x default start-stop group radius
- If DHCP profiling not working → ensure ip helper-address = ISE.
- If SPAN feed → verify switch monitor session is configured.
CLI Validation Outputs
1. Switch-Side Validation (Catalyst 9300)
a) Check 802.1X Auth Session
Switch# show authentication sessions interface Gi1/0/3 details
            Interface:  GigabitEthernet1/0/3
          MAC Address:  00:1a:2b:3c:4d:5e
         IP Address:   10.10.10.55
          User-Name:   host/Win10-Laptop
          Status:      Authorized
          Domain:      DATA
         Oper host mode:    single-host
         Oper control dir:  both
         Session timeout:   1800s (local), Remaining: 1760s
      VLAN:          20
      ISE Security Group Tag: 10 (Employees)
      Server Policies:
        Vlan Group: VLAN20
        dACL: Permit_Employees
        SGT: Employees (10)
This confirms endpoint authenticated successfully, assigned VLAN, dACL, and SGT.
b) Validate CTS/SGT Mapping
Switch# show cts role-based sgt-map
CTS Security Group Tag Mapping Table
--------------------------------------
SGT   Source   IP
10    ISE      10.10.10.55
20    ISE      10.10.20.60
30    ISE      10.10.30.70
Confirms that ISE pushed SGT values to the switch.
c) Verify AAA Accounting → ISE
Switch# show radius statistics
Auth. Requests        : 110
Auth. Responses       : 110
Acct. Requests        : 105
Acct. Responses       : 105
Pending Transactions  : 0
Ensures RADIUS accounting packets (needed for Context Visibility) are reaching ISE.
2. Cisco ISE CLI Validation
a) Profiler Database Status
ise/admin# show profiler database status
Number of Endpoints in Database: 145
Number of Profiles: 82
Active Profiling Policies: 15
Last Profiler Sync: 0 seconds ago
Confirms profiler is active and endpoints are being categorized.
b) Endpoint Detail Lookup (MAC-based)
ise/admin# show endpoint 00:1a:2b:3c:4d:5e
Endpoint MAC Address: 00:1a:2b:3c:4d:5e
IP Address:           10.10.10.55
User Identity:        host/Win10-Laptop
Device Profile:       Microsoft-Workstation
OS:                   Windows 10
Security Group:       Employees (10)
Posture:              Compliant
Status:               Online
Matches GUI Context Visibility Endpoint Details view.
c) pxGrid Connection Status
ise/admin# show running-config pxgrid
pxGrid Enabled: Yes
pxGrid Clients:
   Firepower-SMC (Connected)
   Stealthwatch (Connected)
   DNA-C (Connected)
pxGrid is sharing Context Visibility with other platforms.
d) Application Status (Profiler + pxGrid services)
ise/admin# show application status ise

ISE PROCESS NAME                       STATE           PID
----------------------------------------------------------------
Database Listener (oracle)             running         2653
Application Server (jboss)             running         4312
Profiler Database                      running         6221
pxGrid Infrastructure Service          running         7132
pxGrid Connection Manager              running         7244
AD Connector                           running         8122
M&T Session Database                   running         9250
Confirms Profiler & pxGrid are active (critical for Context Visibility).
e) Debugging Live Profiling (if needed)
ise/admin# debug profiler all
Profiler Debugging enabled
ISE-PROFILER: Received DHCP fingerprint from endpoint 00:1a:2b:3c:4d:5e
ISE-PROFILER: Classified as Microsoft-Workstation, Confidence=90%
Useful for troubleshooting why an endpoint is stuck in “Unknown”.
CLI + GUI Correlation Example
- Switch
show authentication sessions→ Endpoint authorized. - Switch
show cts role-based sgt-map→ SGT mapping confirmed. - ISE
show endpoint <MAC>→ Same endpoint visible with OS, profile, and posture. - ISE Context Visibility GUI → Endpoint appears in Endpoints Tab, with same attributes.
This validates end-to-end data flow: Endpoint → Switch (RADIUS) → ISE (Profiler + DB) → GUI.
Troubleshooting Scenarios
- Problem (what engineer sees)
- Investigation (GUI + CLI validation)
- Fix (step-by-step action)
- Validation (how to prove it’s fixed)
Scenario 1: Endpoint showing as “Unknown OS”
Problem: ISE shows endpoint but OS field = Unknown.
Investigation:
- GUI → Context Visibility → Endpoints → Attributes → check missing fields.
- CLI on ISE →
show profiler database status. - Switch CLI → confirm
ip dhcp snooping+ip device tracking.
Fix: - Enable DHCP probe in ISE (
Administration > System > Settings > Profiler). - Configure switch:
ip dhcp snooping
ip device tracking
ip device tracking probe use-svi
Validation: Endpoint reauthenticates → OS appears (e.g., “Windows 11”).
Scenario 2: Endpoint not visible in Context Visibility
Problem: Authenticated device not seen in dashboard.
Investigation:
- GUI → Operations → RADIUS → Live Logs (does auth entry exist?).
- Switch CLI:
show authentication sessions. - ISE CLI:
show radius statistics.
Fix: - Ensure RADIUS accounting enabled on switch:
aaa accounting dot1x default start-stop group radius
Validation: Device appears in Context Visibility after reauth.
Scenario 3: Endpoint offline in ISE but active on switch
Problem: ISE shows endpoint as offline while switch shows authenticated session.
Investigation:
- Switch CLI →
show authentication sessions interface Gi1/0/3. - ISE MnT logs → check if accounting stop sent prematurely.
Fix: - Check switch timers:
dot1x timeout quiet-period 10
authentication timer reauthenticate server
- Sync timers with ISE session timeout.
Validation: Context Visibility shows endpoint as “Active”.
Scenario 4: Duplicate endpoint entries
Problem: Same MAC appears twice (wired + wireless).
Investigation:
- GUI → Context Visibility → Endpoint history tab.
- ISE CLI:
application configure ise → purge policy.
Fix: - Adjust purge policy → keep only latest session.
- If dual-connect (laptop on wired + Wi-Fi), this is expected.
Validation: Old/stale entries removed after purge.
Scenario 5: Endpoint profile keeps changing
Problem: ISE classifies endpoint as “Apple Device” then “Generic Smartphone”.
Investigation:
- GUI → Work Centers > Profiler > Policy hits.
- ISE CLI:
debug profiler all.
Fix: - Reorder profiling policies (put iPhone > Generic Smartphone).
- Enable additional probes (HTTP, RADIUS).
Validation: Profile stays consistent after reauth.
FAQs – Cisco ISE Context Visibility Dashboard
1. Q: My endpoint shows up in Context Visibility, but the OS and profile type are “Unknown”. Why?
A: This usually means profiling attributes are not reaching ISE. Common causes:
- Switch/WLC not configured to forward DHCP/HTTP/NetFlow info to ISE.
- RADIUS accounting disabled.
- Profiler service not running (check with
show application status ise).
Validate: - CLI:
ise/admin# show profiler database status - GUI: Go to Operations > RADIUS > Live Logs, ensure endpoint attributes are received.
2. Q: How often does the Context Visibility Dashboard refresh endpoint data?
A: By default, the dashboard reflects real-time RADIUS accounting updates. Device attributes update:
- On initial authentication.
- On reauthentication (timers, CoA).
- When profiling probes send new info.
CLI Validation:show endpoint <MAC>to see last updated timestamp.
3. Q: Can I customize the Context Visibility dashboard to only show wireless endpoints?
A: Yes.
- GUI: Use the Filters option (e.g., “Connection Type = Wireless”).
- You can also build saved filters to quickly pivot between Wired, Wireless, VPN, or device profiles.
This helps in large networks where thousands of endpoints are connected.
4. Q: ISE is showing multiple profiles for the same endpoint (e.g., iPhone vs Generic Smartphone). Why?
A: Profiling is confidence-based. If attributes are incomplete, ISE may apply a fallback profile.
- Adjust profiling policy order under Work Centers > Profiler > Profiling Policies.
- Enable more probes (DHCP, SNMP, HTTP).
CLI Debug:
ise/admin# debug profiler all
This shows which probe data influenced the classification.
5. Q: What’s the difference between Context Visibility and Live Logs?
A:
- Live Logs → Shows authentication transactions (real-time AAA events).
- Context Visibility → Aggregates endpoint identity, posture, device profile, SGT, and connection history.
Think of Live Logs as “AAA transactions” and Context Visibility as the “endpoint’s passport”.
6. Q: How do I verify if my WLC is forwarding all endpoint info to ISE for visibility?
A:
- On WLC, check RADIUS config (AAA server, accounting enabled).
- CLI on WLC:
show aaa serversto confirm packets sent. - On ISE, run
show radius statisticsto confirm accounting received.
If data is missing, endpoints will authenticate but appear with incomplete attributes in Context Visibility.
7. Q: Why is an endpoint shown as “offline” in Context Visibility even though it’s connected?
A: Offline usually means:
- No recent RADIUS accounting packets received.
- Endpoint session timed out in ISE but not on switch.
Troubleshooting: - Switch CLI:
show authentication sessions interface Gi1/0/3 - If active on switch, run
resyncby reauthenticating the endpoint.
8. Q: Can I export Context Visibility data for reporting?
A: Yes. You can:
- Export endpoint inventory in CSV/Excel format from Context Visibility GUI.
- Use pxGrid to share data with third-party tools like Cisco Stealthwatch or Splunk.
CLI Check:
ise/admin# show running-config pxgrid
to confirm pxGrid enabled.
9. Q: How do I correlate SGTs (Security Group Tags) with endpoints in Context Visibility?
A:
- GUI: In Context Visibility → Endpoint Details → look for Assigned Security Group.
- CLI: On switch, run
show cts role-based sgt-map.
This correlation validates that ISE classification flows into TrustSec enforcement.
10. Q: Context Visibility shows duplicate entries for the same endpoint. What causes this?
A: Duplicates occur when:
- Endpoint connects to both wired and wireless simultaneously.
- IP changes but session MAC remains.
- Multiple ISE nodes in deployment not fully synchronized.
Fix: - Ensure ISE PAN/MnT synchronization.
- Adjust session timeout/re-auth timers for consistency.
- Use endpoint purge policies to clear stale sessions.
YouTube Link
For more in-depth Cisco ISE Mastery Training, subscribe to my YouTube channel Network Journey and join my instructor-led classes for hands-on, real-world ISE experience
Key Takeaway
Context Visibility is not just a dashboard — it’s the single source of truth for endpoint identity, posture, and SGT enforcement across wired, wireless, and VPN.
Mastering its GUI + CLI validation ensures you can troubleshoot quickly, prove compliance, and integrate ISE with SIEM/Firewalls.
Closing Notes
Cisco ISE Context Visibility is not just a dashboard — it’s your network microscope.
It gives security teams real-time awareness, engineers troubleshooting tools, and auditors compliance evidence.
Combined with TrustSec & pxGrid, it becomes the core intelligence fabric for your zero-trust network.
8. Upgrade Your Skills – Start Today
“For more in-depth Cisco ISE Mastery Training, subscribe to my YouTube channel Network Journey and join my instructor-led classes.”
Fast-Track to Cisco ISE Mastery Pro:
I run a focused 4-month instructor-led CCIE Security training that blends hands-on labs + enterprise case studies.
Course outline: NetworkJourney CCIE Security
If you want to go from ISE beginner → ISE pro, this is the direct path — secure your seat today.
Enroll Now & Future‑Proof Your Career
Email: info@networkjourney.com
WhatsApp / Call: +91 97395 21088